See more : An Hui Wenergy Company Limited (000543.SZ) Income Statement Analysis – Financial Results
Complete financial analysis of Hillenbrand, Inc. (HI) income statement, including revenue, profit margins, EPS and key performance metrics. Get detailed insights into the financial performance of Hillenbrand, Inc., a leading company in the Industrial – Machinery industry within the Industrials sector.
- Ecopro Co., Ltd. (086520.KQ) Income Statement Analysis – Financial Results
- Tamilnadu Telecommunications Limited (TNTELE.BO) Income Statement Analysis – Financial Results
- Saddle Ranch Media, Inc. (SRMX) Income Statement Analysis – Financial Results
- Discover Financial Services (DFS) Income Statement Analysis – Financial Results
- Gold Fields Limited (GFI.JO) Income Statement Analysis – Financial Results
Hillenbrand, Inc. (HI)
About Hillenbrand, Inc.
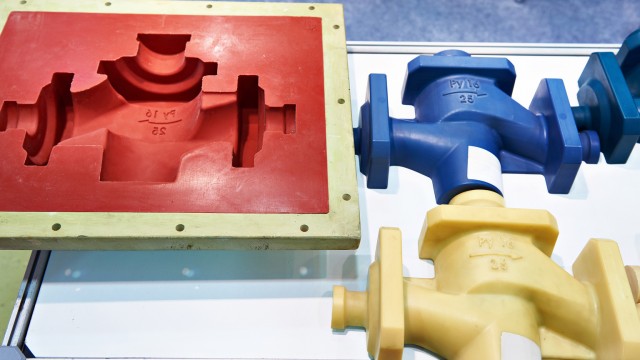
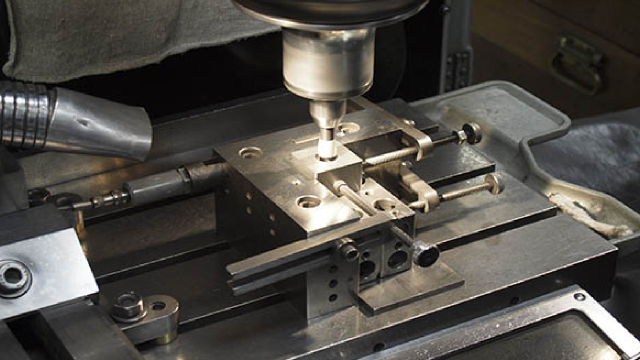
Hillenbrand, Inc. operates as a diversified industrial company in the United States and internationally. It operates in three segments: Advanced Process Solutions, Molding Technology Solutions, and Batesville. The Advanced Process Solutions segment designs, engineers, manufactures, markets, and services process and material handling equipment and systems comprising compounding, extrusion, and material handling equipment, as well as offers equipment system design services; and provides screening and separating equipment for various industries, including plastics, food and pharmaceuticals, chemicals, fertilizers, minerals, energy, wastewater treatment, forest products, and other general industrials. The Molding Technology Solutions segment offers injection molding and extrusion equipment; hot runner systems; process control systems; and mold bases and components for various industries, including automotive, consumer goods, medical, packaging, construction, and electronics. The Batesville segment designs, manufactures, distributes, and sells funeral services products and solutions, such as burial caskets, cremation caskets, containers and urns, other personalization and memorialization products, and web-based technology applications. The company was founded in 1906 and is headquartered in Batesville, Indiana.
| Metric | 2024 | 2023 | 2022 | 2021 | 2020 | 2019 | 2018 | 2017 | 2016 | 2015 | 2014 | 2013 | 2012 | 2011 | 2010 | 2009 | 2008 | 2007 | 2006 | 2005 | 2004 | 2003 | 2002 | 2001 | 2000 |
|---|---|---|---|---|---|---|---|---|---|---|---|---|---|---|---|---|---|---|---|---|---|---|---|---|---|
| Revenue | 3.18B | 2.83B | 2.94B | 2.86B | 2.52B | 1.81B | 1.77B | 1.59B | 1.54B | 1.60B | 1.67B | 1.55B | 983.20M | 883.40M | 749.20M | 649.10M | 678.10M | 667.20M | 1.96B | 659.40M | 640.30M | 1.69B | 1.74B | 1.67B | 1.64B |
| Cost of Revenue | 2.13B | 1.88B | 1.99B | 1.91B | 1.70B | 1.18B | 1.13B | 998.90M | 967.80M | 1.03B | 1.08B | 1.03B | 594.30M | 513.50M | 435.90M | 374.70M | 397.60M | 388.60M | 1.11B | 0.00 | 0.00 | 0.00 | 0.00 | 0.00 | 0.00 |
| Gross Profit | 1.06B | 948.20M | 954.60M | 957.30M | 813.30M | 623.00M | 642.90M | 591.30M | 570.60M | 570.40M | 589.20M | 527.20M | 388.90M | 369.90M | 313.30M | 274.40M | 280.50M | 278.60M | 849.80M | 659.40M | 640.30M | 1.69B | 1.74B | 1.67B | 1.64B |
| Gross Profit Ratio | 33.19% | 33.55% | 32.46% | 33.42% | 32.31% | 34.47% | 36.32% | 37.18% | 37.09% | 35.72% | 35.34% | 33.94% | 39.55% | 41.87% | 41.82% | 42.27% | 41.37% | 41.76% | 43.29% | 100.00% | 100.00% | 100.00% | 100.00% | 100.00% | 100.00% |
| Research & Development | 0.00 | 25.40M | 19.80M | 21.40M | 18.60M | 10.60M | 11.70M | 11.90M | 12.60M | 12.70M | 14.40M | 0.00 | 5.20M | 0.00 | 0.00 | 0.00 | 0.00 | 0.00 | 0.00 | 0.00 | 0.00 | 0.00 | 0.00 | 0.00 | 0.00 |
| General & Administrative | 0.00 | 0.00 | 0.00 | 0.00 | 0.00 | 0.00 | 0.00 | 0.00 | 0.00 | 17.70M | 0.00 | 0.00 | 0.00 | 0.00 | 0.00 | 0.00 | 0.00 | 0.00 | 0.00 | 0.00 | 0.00 | 0.00 | 0.00 | 0.00 | 0.00 |
| Selling & Marketing | 0.00 | 0.00 | 0.00 | 0.00 | 0.00 | 0.00 | 0.00 | 0.00 | 0.00 | 0.00 | 0.00 | 0.00 | 0.00 | 0.00 | 0.00 | 0.00 | 0.00 | 0.00 | 0.00 | 0.00 | 0.00 | 0.00 | 0.00 | 0.00 | 0.00 |
| SG&A | 0.00 | 544.20M | 420.20M | 464.90M | 433.40M | 343.50M | 362.40M | 327.90M | 322.30M | 17.70M | 348.40M | 318.60M | 240.10M | 211.30M | 0.00 | 0.00 | 130.90M | 0.00 | 0.00 | 0.00 | 0.00 | 0.00 | 0.00 | 0.00 | 0.00 |
| Other Expenses | 1.06B | 574.00M | 576.10M | 582.10M | 610.10M | 412.20M | -600.00K | -4.20M | -1.70M | -1.40M | 2.20M | -500.00K | 240.10M | 211.30M | 175.40M | 119.40M | 0.00 | 117.90M | 526.80M | 0.00 | 0.00 | 1.36B | 1.69B | 1.43B | 1.43B |
| Operating Expenses | 1.06B | 948.20M | 576.10M | 582.10M | 610.10M | 412.20M | 409.10M | 373.60M | 379.50M | 376.40M | 414.70M | 409.10M | 240.10M | 211.30M | 175.40M | 119.40M | 130.90M | 117.90M | 526.80M | 0.00 | 0.00 | 1.36B | 1.69B | 1.43B | 1.43B |
| Cost & Expenses | 3.18B | 2.41B | 2.56B | 2.49B | 2.31B | 1.60B | 1.54B | 1.37B | 1.35B | 1.40B | 1.49B | 1.44B | 834.40M | 724.80M | 611.30M | 494.10M | 528.50M | 506.50M | 1.64B | 0.00 | 0.00 | 1.36B | 1.69B | 1.43B | 1.43B |
| Interest Income | 0.00 | 0.00 | 5.50M | 3.40M | 3.20M | 32.70M | 1.40M | 0.00 | 0.00 | 0.00 | 0.00 | 0.00 | 0.00 | 11.80M | 12.20M | 13.50M | 7.50M | 1.40M | 42.70M | 0.00 | 0.00 | 0.00 | 0.00 | 0.00 | 0.00 |
| Interest Expense | 121.50M | 77.70M | 69.80M | 77.60M | 77.40M | 27.40M | 23.30M | 25.20M | 25.30M | 23.80M | 23.30M | 24.00M | 12.40M | 11.00M | 4.20M | 2.10M | 2.20M | 1.40M | 21.30M | 0.00 | 0.00 | 0.00 | 0.00 | 0.00 | 0.00 |
| Depreciation & Amortization | 158.00M | 125.60M | 98.60M | 115.10M | 130.60M | 58.50M | 56.50M | 56.60M | 60.40M | 54.30M | 58.40M | 89.40M | 40.40M | 36.10M | 28.50M | 18.60M | 19.10M | 18.50M | 108.80M | 0.00 | 0.00 | 0.00 | 0.00 | 0.00 | 0.00 |
| EBITDA | 140.10M | 420.20M | 401.50M | 546.50M | 330.40M | 269.20M | 296.10M | 286.90M | 269.90M | 278.90M | 267.70M | 250.60M | 187.70M | 204.90M | 179.10M | 181.50M | 174.60M | 175.50M | 195.10M | 659.40M | 640.30M | 331.30M | 46.00M | 242.00M | 204.00M |
| EBITDA Ratio | 4.40% | 14.87% | 14.99% | 15.05% | 10.95% | 13.09% | 14.88% | 15.26% | 14.46% | 15.33% | 14.27% | 13.24% | 19.41% | 23.38% | 23.84% | 28.82% | 24.88% | 26.86% | 24.17% | 100.00% | 100.00% | 19.56% | 2.65% | 14.47% | 12.46% |
| Operating Income | 0.00 | 411.80M | 386.90M | 375.50M | 203.70M | 204.10M | 233.80M | 217.70M | 191.10M | 194.00M | 174.50M | 118.10M | 148.80M | 158.60M | 137.90M | 155.00M | 149.60M | 160.70M | 323.00M | 659.40M | 640.30M | 331.30M | 46.00M | 242.00M | 204.00M |
| Operating Income Ratio | 0.00% | 14.57% | 13.16% | 13.11% | 8.09% | 11.29% | 13.21% | 13.69% | 12.42% | 12.15% | 10.47% | 7.60% | 15.13% | 17.95% | 18.41% | 23.88% | 22.06% | 24.09% | 16.46% | 100.00% | 100.00% | 19.56% | 2.65% | 14.47% | 12.46% |
| Total Other Income/Expenses | -139.40M | -194.90M | -137.40M | -21.70M | -271.60M | -34.10M | -86.50M | -29.80M | -27.00M | -31.70M | -14.60M | -24.40M | -13.90M | -800.00K | 8.50M | 5.80M | 3.70M | 1.40M | -144.20M | -659.40M | -640.30M | -51.00M | -27.00M | -21.00M | 0.00 |
| Income Before Tax | -139.40M | 216.90M | 314.00M | 353.80M | -18.50M | 176.70M | 146.50M | 188.30M | 164.10M | 162.30M | 159.90M | 93.70M | 134.90M | 157.80M | 146.40M | 160.80M | 153.30M | 157.00M | 339.00M | 0.00 | 0.00 | 280.30M | 19.00M | 221.00M | 204.00M |
| Income Before Tax Ratio | -4.38% | 7.68% | 10.68% | 12.35% | -0.74% | 9.78% | 8.28% | 11.84% | 10.67% | 10.16% | 9.59% | 6.03% | 13.72% | 17.86% | 19.54% | 24.77% | 22.61% | 23.53% | 17.27% | 0.00% | 0.00% | 16.55% | 1.09% | 13.21% | 12.46% |
| Income Tax Expense | 64.80M | 102.80M | 98.80M | 98.60M | 34.90M | 50.50M | 65.30M | 59.90M | 47.30M | 49.10M | 48.70M | 28.30M | 30.10M | 51.70M | 54.10M | 58.50M | 60.10M | 57.50M | 117.50M | -102.80M | -113.80M | 99.70M | -37.00M | 52.00M | 74.00M |
| Net Income | -204.20M | 569.70M | 208.90M | 249.90M | -53.40M | 121.40M | 76.60M | 126.20M | 112.80M | 111.40M | 109.70M | 63.40M | 104.80M | 106.10M | 92.30M | 102.30M | 93.20M | 99.50M | 221.20M | 102.80M | 113.80M | 189.00M | 44.00M | 170.00M | 154.00M |
| Net Income Ratio | -6.42% | 20.16% | 7.10% | 8.72% | -2.12% | 6.72% | 4.33% | 7.94% | 7.33% | 6.98% | 6.58% | 4.08% | 10.66% | 12.01% | 12.32% | 15.76% | 13.74% | 14.91% | 11.27% | 15.59% | 17.77% | 11.16% | 2.53% | 10.16% | 9.41% |
| EPS | -2.90 | 8.16 | 2.91 | 3.34 | -0.73 | 1.93 | 1.21 | 1.99 | 1.78 | 1.76 | 1.74 | 1.01 | 1.68 | 1.71 | 1.49 | 1.66 | 1.49 | 1.59 | 1.82 | 1.64 | 1.82 | 3.02 | 0.70 | 2.72 | 2.46 |
| EPS Diluted | -2.90 | 8.13 | 2.89 | 3.31 | -0.73 | 1.92 | 1.20 | 1.97 | 1.77 | 1.74 | 1.72 | 1.01 | 1.68 | 1.71 | 1.49 | 1.66 | 1.49 | 1.59 | 1.82 | 1.64 | 1.82 | 3.02 | 0.70 | 2.72 | 2.46 |
| Weighted Avg Shares Out | 70.40M | 69.80M | 71.70M | 74.90M | 73.40M | 62.90M | 63.10M | 63.60M | 63.30M | 63.20M | 63.20M | 62.70M | 62.20M | 62.00M | 61.90M | 61.70M | 62.50M | 62.50M | 62.30M | 62.68M | 62.53M | 62.50M | 62.50M | 62.50M | 62.50M |
| Weighted Avg Shares Out (Dil) | 70.40M | 70.10M | 72.20M | 75.40M | 73.40M | 63.30M | 63.80M | 64.00M | 63.80M | 63.90M | 63.80M | 63.00M | 62.40M | 62.00M | 61.90M | 61.70M | 62.50M | 62.50M | 62.30M | 62.68M | 62.53M | 62.68M | 62.68M | 62.68M | 62.68M |

Hillenbrand, Inc. (HI) Q4 2022 Earnings Call Transcript

HI vs. MSM: Which Stock Is the Better Value Option?

7 Small Company Stocks You Should Own Now

Hillenbrand to Present at Sidoti September Small-Cap Virtual Conference

Hillenbrand Is Likely To Sell Batesville Well

Is Hillenbrand (HI) Stock Undervalued Right Now?

Hillenbrand, Inc. (HI) CEO Kim Ryan on Q3 2022 Results - Earnings Call Transcript

Hillenbrand (HI) Surpasses Q3 Earnings and Revenue Estimates

Hillenbrand Schedules Third Quarter 2022 Earnings Call for August 4, 2022

This is Why Hillenbrand (HI) is a Great Dividend Stock
Source: https://incomestatements.info
Category: Stock Reports
