See more : Ri Ying Holdings Limited (1741.HK) Income Statement Analysis – Financial Results
Complete financial analysis of HelloFresh SE (HLFFF) income statement, including revenue, profit margins, EPS and key performance metrics. Get detailed insights into the financial performance of HelloFresh SE, a leading company in the Restaurants industry within the Consumer Cyclical sector.
- Lakeside Bancshares, Inc. (LKSB) Income Statement Analysis – Financial Results
- The SPAR Group Ltd (SGPPF) Income Statement Analysis – Financial Results
- JZ Capital 2021 6% CULS (JZCC.L) Income Statement Analysis – Financial Results
- Japan Transcity Corporation (9310.T) Income Statement Analysis – Financial Results
- Oryx Technology Corp. (ORYX) Income Statement Analysis – Financial Results
HelloFresh SE (HLFFF)
About HelloFresh SE
HelloFresh SE delivers meal kit solutions to prepare home-cooked meals using its recipes. The company offers premium meals, double portions, and others, as well as add-ons, such as soups, snacks, fruit boxes, desserts, ready-to-eat meals, and seasonal boxes. It also sells meal-kits through vending machines. The company has operations in the United States, Australia, Austria, Belgium, Canada, Germany, France, Luxembourg, the Netherlands, New Zealand, Switzerland, Sweden, Denmark, Norway, Italy, Japan, and the United Kingdom. It operates under the HelloFresh brand; and owns the Chefs Plate, EveryPlate, Factor75, Green Chef, and YouFoodz brand names. HelloFresh SE was founded in 2011 and is headquartered in Berlin, Germany.
| Metric | 2023 | 2022 | 2021 | 2020 | 2019 | 2018 | 2017 | 2016 | 2015 | 2014 | 2013 | 2012 |
|---|---|---|---|---|---|---|---|---|---|---|---|---|
| Revenue | 7.60B | 7.61B | 5.99B | 3.75B | 1.81B | 1.28B | 904.90M | 596.99M | 304.95M | 69.62M | 14.16M | 2.32M |
| Cost of Revenue | 2.68B | 2.62B | 2.05B | 1.28B | 640.50M | 475.60M | 365.80M | 257.35M | 146.09M | 31.14M | 6.82M | 2.08M |
| Gross Profit | 4.92B | 4.99B | 3.95B | 2.47B | 1.17B | 803.60M | 539.10M | 339.65M | 158.87M | 38.48M | 7.34M | 240.00K |
| Gross Profit Ratio | 64.78% | 65.56% | 65.86% | 65.95% | 64.59% | 62.82% | 59.58% | 56.89% | 52.10% | 55.27% | 51.84% | 10.34% |
| Research & Development | 0.00 | 132.00M | 74.50M | 47.60M | 38.20M | 2.80M | 1.80M | 0.00 | 0.00 | 0.00 | 0.00 | 0.00 |
| General & Administrative | 121.80M | 119.79M | 186.90M | 132.80M | 119.50M | 94.60M | 50.30M | 29.32M | 30.63M | 7.48M | 3.76M | 4.30M |
| Selling & Marketing | 1.44B | 1.19B | 860.00M | 468.40M | 404.10M | 329.70M | 239.40M | 157.18M | 120.31M | 22.32M | 4.39M | 1.75M |
| SG&A | 4.78B | 1.31B | 1.05B | 601.20M | 523.60M | 424.30M | 289.70M | 186.49M | 150.94M | 29.79M | 8.15M | 6.05M |
| Other Expenses | 0.00 | 3.44B | 2.51B | 1.43B | 664.00M | 457.10M | 334.90M | 240.10M | 121.96M | 23.29M | 5.23M | 1.16M |
| Operating Expenses | 4.81B | 4.75B | 3.56B | 2.04B | 1.19B | 881.40M | 624.60M | 426.60M | 272.90M | 53.09M | 13.39M | 7.20M |
| Cost & Expenses | 7.48B | 7.37B | 5.60B | 3.31B | 1.83B | 1.36B | 990.40M | 683.94M | 418.99M | 84.23M | 20.20M | 9.29M |
| Interest Income | 7.60M | 3.00M | 500.00K | 1.00M | 600.00K | 300.00K | 100.00K | 70.00K | 0.00 | 7.00K | 0.00 | 0.00 |
| Interest Expense | 35.30M | 27.60M | 20.00M | 10.00M | 6.40M | 1.20M | 4.70M | 3.08M | 0.00 | 836.00K | 164.00K | 638.00K |
| Depreciation & Amortization | 231.30M | 165.80M | 96.80M | 47.00M | 39.80M | 12.50M | 8.10M | 4.31M | 652.00K | 180.00K | 146.00K | 27.00K |
| EBITDA | 339.90M | 393.40M | 487.51M | 452.80M | 47.60M | -72.40M | -82.30M | -86.60M | -114.58M | -15.59M | -6.32M | -7.57M |
| EBITDA Ratio | 4.47% | 5.48% | 8.36% | 12.38% | 2.63% | -4.68% | -8.73% | -13.92% | -37.57% | -20.03% | -42.09% | -300.69% |
| Operating Income | 112.50M | 217.40M | 391.80M | 425.90M | 7.80M | -82.80M | -88.80M | -90.46M | -115.51M | -15.78M | -6.46M | -7.61M |
| Operating Income Ratio | 1.48% | 2.86% | 6.54% | 11.36% | 0.43% | -6.47% | -9.81% | -15.15% | -37.88% | -22.66% | -45.64% | -327.73% |
| Total Other Income/Expenses | -39.20M | -17.40M | -7.79M | -30.10M | 20.50M | 3.30M | -6.30M | -3.67M | -1.29M | 7.00K | -1.00K | 9.00K |
| Income Before Tax | 73.30M | 200.00M | 384.00M | 395.80M | -5.30M | -78.60M | -95.10M | -94.13M | -116.75M | -15.77M | -6.46M | -7.60M |
| Income Before Tax Ratio | 0.96% | 2.63% | 6.41% | 10.55% | -0.29% | -6.14% | -10.51% | -15.77% | -38.29% | -22.65% | -45.65% | -327.35% |
| Income Tax Expense | 55.20M | 74.90M | 127.70M | 26.70M | 4.80M | 4.20M | -3.10M | -270.00K | 3.00K | -405.00K | 1.00K | 542.00K |
| Net Income | 19.40M | 127.00M | 242.81M | 369.00M | -10.10M | -82.50M | -91.80M | -93.80M | -113.76M | -14.56M | -6.27M | -7.55M |
| Net Income Ratio | 0.26% | 1.67% | 4.05% | 9.84% | -0.56% | -6.45% | -10.14% | -15.71% | -37.30% | -20.91% | -44.29% | -325.19% |
| EPS | 0.09 | 0.74 | 1.40 | 2.19 | -0.06 | -0.51 | -0.67 | -0.75 | -0.96 | -0.23 | -0.05 | -0.06 |
| EPS Diluted | 0.10 | 0.63 | 1.40 | 2.09 | -0.06 | -0.51 | -0.67 | -0.75 | -0.96 | -0.23 | -0.05 | -0.06 |
| Weighted Avg Shares Out | 194.11M | 171.70M | 173.60M | 168.40M | 164.10M | 161.10M | 136.60M | 125.50M | 118.87M | 63.76M | 131.90M | 131.90M |
| Weighted Avg Shares Out (Dil) | 176.10M | 179.20M | 173.60M | 177.60M | 164.10M | 161.10M | 136.60M | 125.50M | 118.87M | 63.76M | 131.90M | 131.90M |

HelloFresh: At This Price, It Is A Buy

HelloFresh SE (HLFFF) Q4 2023 Earnings Call Transcript

HelloFresh investors struggle to swallow strategy revamp

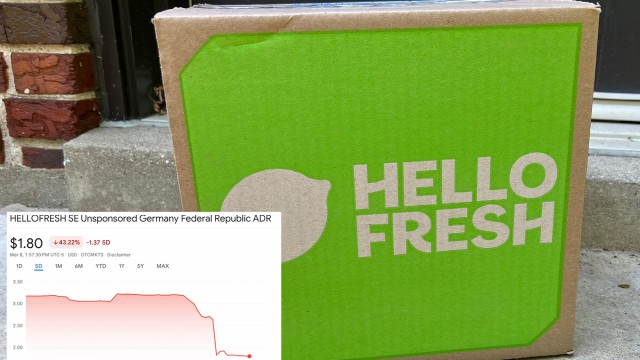
HelloFresh Stock Falls to Record Low After Projecting Lower Profit

HelloFresh shares plummet 42% after meal kit giant delivers outlook ‘far worse' than anticipated

HelloFresh shares dive 42% after meal kit giant warns on outlook

HelloFresh: Market Overreaction Creates An Opportunity

HelloFresh Doubles Down on Commitment to Fight Hunger This Holiday Season, As Data Shows Nearly One in Three Americans Have Experienced Food Insecurity

HelloFresh Brings Back Fan-Favorite Buddy the Elf™ Spaghetti Meal Kits with a Twist and Debuts Limited Edition Elf-Themed Recipes

3 Meal Kit Delivery Stocks Serving Convenience — and Profits
Source: https://incomestatements.info
Category: Stock Reports
