See more : Regency Ceramics Limited (REGENCERAM.NS) Income Statement Analysis – Financial Results
Complete financial analysis of HelloFresh SE (HLFFF) income statement, including revenue, profit margins, EPS and key performance metrics. Get detailed insights into the financial performance of HelloFresh SE, a leading company in the Restaurants industry within the Consumer Cyclical sector.
- Imagine Lithium Inc. (ARXRF) Income Statement Analysis – Financial Results
- Alvo Minerals Limited (ALV.AX) Income Statement Analysis – Financial Results
- Vincerx Pharma, Inc. (VINCU) Income Statement Analysis – Financial Results
- Oaktree Acquisition Corp. III Life Sciences Unit (OACCU) Income Statement Analysis – Financial Results
- Jumbo S.A. (JUMSF) Income Statement Analysis – Financial Results
HelloFresh SE (HLFFF)
About HelloFresh SE
HelloFresh SE delivers meal kit solutions to prepare home-cooked meals using its recipes. The company offers premium meals, double portions, and others, as well as add-ons, such as soups, snacks, fruit boxes, desserts, ready-to-eat meals, and seasonal boxes. It also sells meal-kits through vending machines. The company has operations in the United States, Australia, Austria, Belgium, Canada, Germany, France, Luxembourg, the Netherlands, New Zealand, Switzerland, Sweden, Denmark, Norway, Italy, Japan, and the United Kingdom. It operates under the HelloFresh brand; and owns the Chefs Plate, EveryPlate, Factor75, Green Chef, and YouFoodz brand names. HelloFresh SE was founded in 2011 and is headquartered in Berlin, Germany.
| Metric | 2023 | 2022 | 2021 | 2020 | 2019 | 2018 | 2017 | 2016 | 2015 | 2014 | 2013 | 2012 |
|---|---|---|---|---|---|---|---|---|---|---|---|---|
| Revenue | 7.60B | 7.61B | 5.99B | 3.75B | 1.81B | 1.28B | 904.90M | 596.99M | 304.95M | 69.62M | 14.16M | 2.32M |
| Cost of Revenue | 2.68B | 2.62B | 2.05B | 1.28B | 640.50M | 475.60M | 365.80M | 257.35M | 146.09M | 31.14M | 6.82M | 2.08M |
| Gross Profit | 4.92B | 4.99B | 3.95B | 2.47B | 1.17B | 803.60M | 539.10M | 339.65M | 158.87M | 38.48M | 7.34M | 240.00K |
| Gross Profit Ratio | 64.78% | 65.56% | 65.86% | 65.95% | 64.59% | 62.82% | 59.58% | 56.89% | 52.10% | 55.27% | 51.84% | 10.34% |
| Research & Development | 0.00 | 132.00M | 74.50M | 47.60M | 38.20M | 2.80M | 1.80M | 0.00 | 0.00 | 0.00 | 0.00 | 0.00 |
| General & Administrative | 121.80M | 119.79M | 186.90M | 132.80M | 119.50M | 94.60M | 50.30M | 29.32M | 30.63M | 7.48M | 3.76M | 4.30M |
| Selling & Marketing | 1.44B | 1.19B | 860.00M | 468.40M | 404.10M | 329.70M | 239.40M | 157.18M | 120.31M | 22.32M | 4.39M | 1.75M |
| SG&A | 4.78B | 1.31B | 1.05B | 601.20M | 523.60M | 424.30M | 289.70M | 186.49M | 150.94M | 29.79M | 8.15M | 6.05M |
| Other Expenses | 0.00 | 3.44B | 2.51B | 1.43B | 664.00M | 457.10M | 334.90M | 240.10M | 121.96M | 23.29M | 5.23M | 1.16M |
| Operating Expenses | 4.81B | 4.75B | 3.56B | 2.04B | 1.19B | 881.40M | 624.60M | 426.60M | 272.90M | 53.09M | 13.39M | 7.20M |
| Cost & Expenses | 7.48B | 7.37B | 5.60B | 3.31B | 1.83B | 1.36B | 990.40M | 683.94M | 418.99M | 84.23M | 20.20M | 9.29M |
| Interest Income | 7.60M | 3.00M | 500.00K | 1.00M | 600.00K | 300.00K | 100.00K | 70.00K | 0.00 | 7.00K | 0.00 | 0.00 |
| Interest Expense | 35.30M | 27.60M | 20.00M | 10.00M | 6.40M | 1.20M | 4.70M | 3.08M | 0.00 | 836.00K | 164.00K | 638.00K |
| Depreciation & Amortization | 231.30M | 165.80M | 96.80M | 47.00M | 39.80M | 12.50M | 8.10M | 4.31M | 652.00K | 180.00K | 146.00K | 27.00K |
| EBITDA | 339.90M | 393.40M | 487.51M | 452.80M | 47.60M | -72.40M | -82.30M | -86.60M | -114.58M | -15.59M | -6.32M | -7.57M |
| EBITDA Ratio | 4.47% | 5.48% | 8.36% | 12.38% | 2.63% | -4.68% | -8.73% | -13.92% | -37.57% | -20.03% | -42.09% | -300.69% |
| Operating Income | 112.50M | 217.40M | 391.80M | 425.90M | 7.80M | -82.80M | -88.80M | -90.46M | -115.51M | -15.78M | -6.46M | -7.61M |
| Operating Income Ratio | 1.48% | 2.86% | 6.54% | 11.36% | 0.43% | -6.47% | -9.81% | -15.15% | -37.88% | -22.66% | -45.64% | -327.73% |
| Total Other Income/Expenses | -39.20M | -17.40M | -7.79M | -30.10M | 20.50M | 3.30M | -6.30M | -3.67M | -1.29M | 7.00K | -1.00K | 9.00K |
| Income Before Tax | 73.30M | 200.00M | 384.00M | 395.80M | -5.30M | -78.60M | -95.10M | -94.13M | -116.75M | -15.77M | -6.46M | -7.60M |
| Income Before Tax Ratio | 0.96% | 2.63% | 6.41% | 10.55% | -0.29% | -6.14% | -10.51% | -15.77% | -38.29% | -22.65% | -45.65% | -327.35% |
| Income Tax Expense | 55.20M | 74.90M | 127.70M | 26.70M | 4.80M | 4.20M | -3.10M | -270.00K | 3.00K | -405.00K | 1.00K | 542.00K |
| Net Income | 19.40M | 127.00M | 242.81M | 369.00M | -10.10M | -82.50M | -91.80M | -93.80M | -113.76M | -14.56M | -6.27M | -7.55M |
| Net Income Ratio | 0.26% | 1.67% | 4.05% | 9.84% | -0.56% | -6.45% | -10.14% | -15.71% | -37.30% | -20.91% | -44.29% | -325.19% |
| EPS | 0.09 | 0.74 | 1.40 | 2.19 | -0.06 | -0.51 | -0.67 | -0.75 | -0.96 | -0.23 | -0.05 | -0.06 |
| EPS Diluted | 0.10 | 0.63 | 1.40 | 2.09 | -0.06 | -0.51 | -0.67 | -0.75 | -0.96 | -0.23 | -0.05 | -0.06 |
| Weighted Avg Shares Out | 194.11M | 171.70M | 173.60M | 168.40M | 164.10M | 161.10M | 136.60M | 125.50M | 118.87M | 63.76M | 131.90M | 131.90M |
| Weighted Avg Shares Out (Dil) | 176.10M | 179.20M | 173.60M | 177.60M | 164.10M | 161.10M | 136.60M | 125.50M | 118.87M | 63.76M | 131.90M | 131.90M |
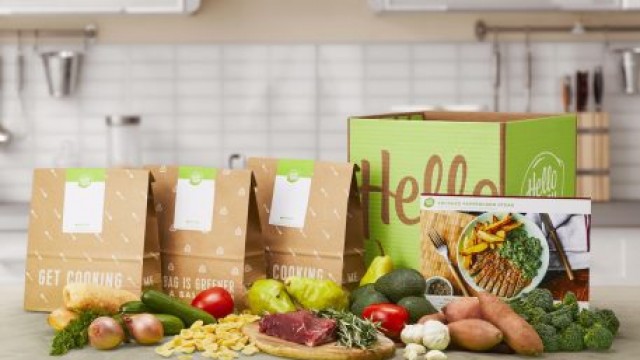
HelloFresh Sees Pandemic Cooking Habits Continuing Into the Future

HelloFresh SE (HLFFF) CEO Dominik Richter on Q1 2022 Results - Earnings Call Transcript
Bestinfond's Top 4 Trades of the 4th Quarter

HelloFresh SE (HLFFF) CEO Dominik Richter on Q4 2021 Results - Earnings Call Transcript
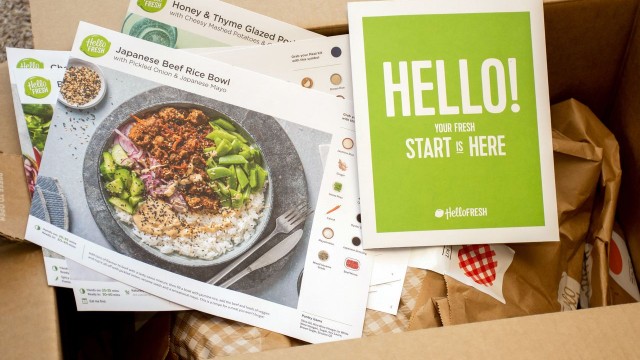
HelloFresh Has the Right Ingredients for Growth

HelloFresh - A History Of Managerial Success, Much Appreciated By The Market
HelloFresh Workers Claim Retaliation For Unionizing, According To Report
HelloFresh lifts 2021 revenue target as 3Q sales beat forecasts
HelloFresh to spend nearly $60 million for new hires in tight labour market

HelloFresh rakes in billions as people are hungry for meal kits
Source: https://incomestatements.info
Category: Stock Reports
