See more : Churchill Capital Corp V (CCV-UN) Income Statement Analysis – Financial Results
Complete financial analysis of Hailiang Education Group Inc. (HLG) income statement, including revenue, profit margins, EPS and key performance metrics. Get detailed insights into the financial performance of Hailiang Education Group Inc., a leading company in the Education & Training Services industry within the Consumer Defensive sector.
- BCPL Railway Infrastructure Li (BCPL.BO) Income Statement Analysis – Financial Results
- Enchanted World Inc. (ENCW) Income Statement Analysis – Financial Results
- Suoxinda Holdings Limited (3680.HK) Income Statement Analysis – Financial Results
- Bangkok Bank Public Company Limited (BKKPF) Income Statement Analysis – Financial Results
- Metalliance SA (MLETA.PA) Income Statement Analysis – Financial Results
Hailiang Education Group Inc. (HLG)
Industry: Education & Training Services
Sector: Consumer Defensive
Website: https://www.hailiangedu.com
About Hailiang Education Group Inc.
Hailiang Education Group Inc. provides K-12 educational and management services in the People's Republic of China. The company operates 14 affiliated schools; and 27 managed schools. It offers K-12 student management, high school curriculum education, and operation and management services, including branding, academic management, education resources, school culture, admission, finance, human resources, procurement, IT, internal audit, and property and logistics management services, as well as after-school enrichment, accommodations, and transportation services. The company also provides ancillary educational services, such as well-rounded education, academic subject tutoring, study trip, and overseas study consulting services; and hotel management services. In addition, its schools offer basic educational and international programs at the primary school, middle school, and high school levels; courses designed for students, such as A-levels courses for the United Kingdom universities, AP courses for the United States universities, Victorian Certificate of Education (VCE) courses for Australian universities, and International Baccalaureate (IB) courses for various countries in the world; and language courses, including Japanese, Korean, and Spanish. As of June 30, 2021, the company had 10,402 students enrolled in its affiliated schools; and 43,897 students enrolled in its managed schools. Hailiang Education Group Inc. was founded in 1995 and is based in Hangzhou, the People's Republic of China.
| Metric | 2021 | 2020 | 2019 | 2018 | 2017 | 2016 | 2015 | 2014 | 2013 | 2012 |
|---|---|---|---|---|---|---|---|---|---|---|
| Revenue | 1.38B | 1.48B | 1.50B | 1.17B | 853.30M | 654.06M | 514.79M | 462.75M | 436.99M | 349.60M |
| Cost of Revenue | 728.59M | 983.18M | 1.03B | 804.67M | 645.76M | 491.36M | 334.53M | 299.68M | 293.76M | 239.07M |
| Gross Profit | 647.20M | 499.42M | 472.12M | 364.67M | 207.54M | 162.70M | 180.26M | 163.07M | 143.23M | 110.53M |
| Gross Profit Ratio | 47.04% | 33.69% | 31.50% | 31.19% | 24.32% | 24.88% | 35.02% | 35.24% | 32.78% | 31.62% |
| Research & Development | 0.00 | 0.00 | 0.00 | 0.00 | 0.00 | 0.00 | 0.00 | 0.00 | 0.00 | 0.00 |
| General & Administrative | 51.32M | 77.54M | 72.66M | 63.37M | 31.11M | 43.74M | 33.33M | 28.62M | 23.08M | 24.75M |
| Selling & Marketing | 29.74M | 26.90M | 25.00M | 24.54M | 21.90M | 16.75M | 15.54M | 15.64M | 17.63M | 16.30M |
| SG&A | 81.06M | 104.44M | 97.66M | 87.91M | 53.01M | 60.49M | 48.87M | 44.26M | 40.71M | 41.05M |
| Other Expenses | -46.63M | -72.78M | -25.44M | -5.83M | -6.33M | -1.76M | -2.46M | -1.79M | -4.09M | -4.05M |
| Operating Expenses | 34.43M | 31.66M | 72.23M | 82.08M | 46.69M | 58.74M | 46.41M | 42.47M | 36.62M | 37.00M |
| Cost & Expenses | 763.01M | 1.01B | 1.10B | 886.76M | 692.44M | 550.09M | 380.94M | 342.15M | 330.38M | 276.06M |
| Interest Income | 35.99M | 24.83M | 24.47M | 11.72M | 6.71M | 4.91M | 7.23M | 20.15M | 17.19M | 11.79M |
| Interest Expense | 1.15M | 4.36M | 465.00K | 0.00 | 0.00 | 0.00 | 0.00 | 0.00 | 0.00 | 0.00 |
| Depreciation & Amortization | 169.73M | 165.83M | 133.52M | 113.57M | 111.15M | 65.99M | 26.19M | 25.05M | 24.88M | 22.77M |
| EBITDA | 571.33M | 662.95M | 536.12M | 402.45M | 278.89M | 165.42M | 167.18M | 165.72M | 148.07M | 105.80M |
| EBITDA Ratio | 41.53% | 44.72% | 35.76% | 34.42% | 32.68% | 25.29% | 32.48% | 35.81% | 33.88% | 30.26% |
| Operating Income | 612.78M | 467.77M | 399.56M | 280.45M | 160.85M | 108.87M | 133.85M | 120.61M | 106.62M | 73.53M |
| Operating Income Ratio | 44.54% | 31.55% | 26.65% | 23.98% | 18.85% | 16.65% | 26.00% | 26.06% | 24.40% | 21.03% |
| Total Other Income/Expenses | 34.69M | 20.76M | 24.94M | 16.74M | 6.89M | 5.75M | 7.15M | 20.07M | 16.58M | 11.58M |
| Income Before Tax | 647.47M | 488.52M | 424.49M | 297.19M | 167.74M | 99.43M | 140.99M | 140.67M | 123.19M | 85.12M |
| Income Before Tax Ratio | 47.06% | 32.95% | 28.32% | 25.42% | 19.66% | 15.20% | 27.39% | 30.40% | 28.19% | 24.35% |
| Income Tax Expense | 165.36M | 121.92M | 108.71M | 66.29M | 6.89M | 5.75M | 7.15M | 20.07M | 16.58M | 11.58M |
| Net Income | 235.09M | 370.83M | 293.42M | 222.59M | 167.74M | 99.43M | 140.99M | 140.67M | 123.19M | 83.03M |
| Net Income Ratio | 17.09% | 25.01% | 19.57% | 19.04% | 19.66% | 15.20% | 27.39% | 30.40% | 28.19% | 23.75% |
| EPS | 9.12 | 14.39 | 11.38 | 8.63 | 6.53 | 3.88 | 5.82 | 5.48 | 4.80 | 3.23 |
| EPS Diluted | 9.12 | 14.39 | 11.38 | 8.63 | 6.53 | 3.88 | 5.82 | 5.48 | 4.80 | 3.23 |
| Weighted Avg Shares Out | 25.78M | 25.78M | 25.78M | 25.78M | 25.70M | 25.65M | 24.24M | 25.67M | 25.67M | 25.67M |
| Weighted Avg Shares Out (Dil) | 25.78M | 25.78M | 25.78M | 25.78M | 25.70M | 25.65M | 24.24M | 25.67M | 25.67M | 25.67M |

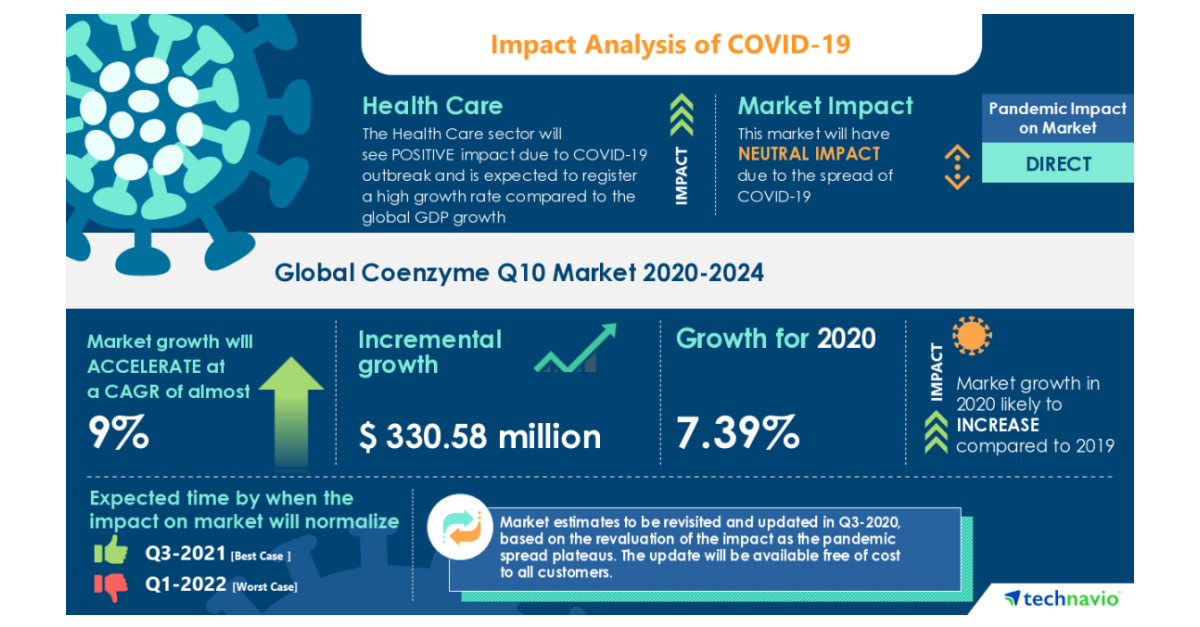
COVID-19 Recovery Analysis: Coenzyme Q10 Market | Growing Disposable Income to Boost the Market Growth | Technavio

Hailiang Education Group (NASDAQ:HLG) Upgraded to Sell by BidaskClub

Mobileye, Geely to Offer Most Robust Driver-Assistance Features

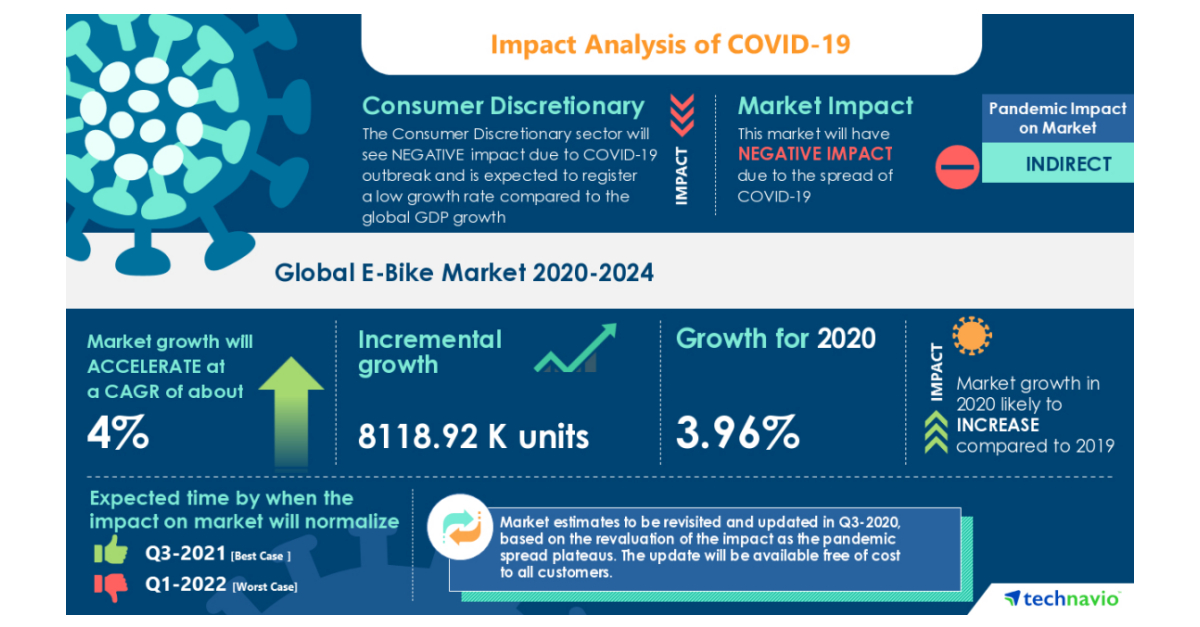
COVID-19: E-bike Market (2020-2024)- Roadmap for Recovery | Declining Cost of Li-ion Batteries to Boost the Market Growth | Technavio

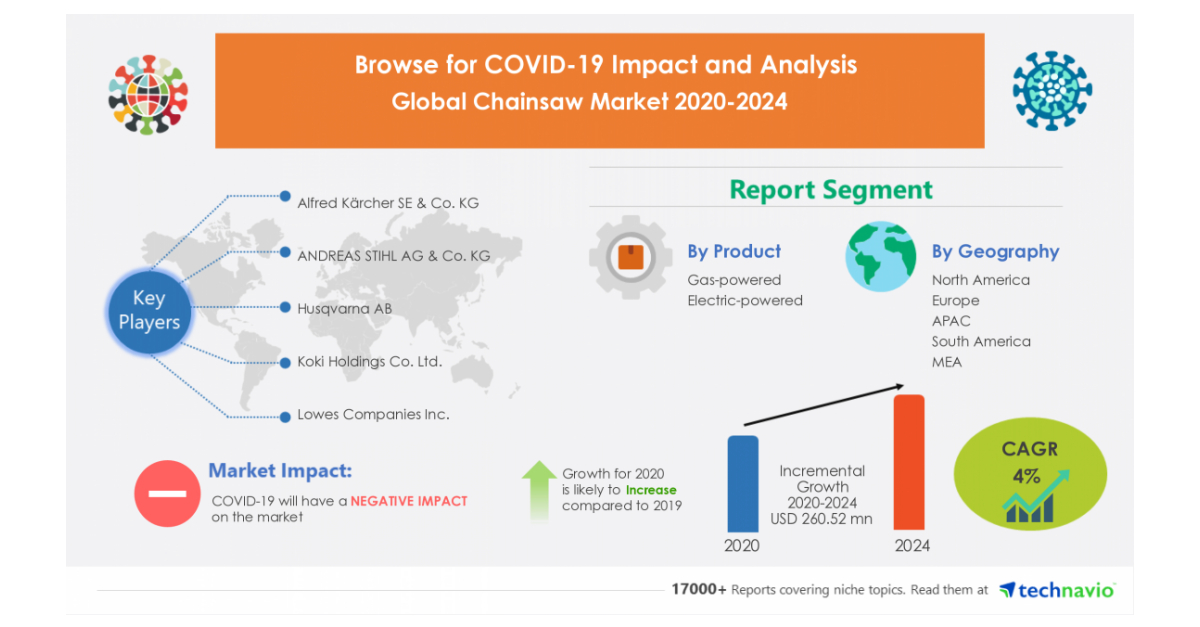
Chainsaw Market | Insights on the Crisis and the Roadmap to Recovery from COVID-19 Pandemic | Technavio
Source: https://incomestatements.info
Category: Stock Reports


