See more : Homeland Interactive Technology Ltd. (3798.HK) Income Statement Analysis – Financial Results
Complete financial analysis of The Honest Company, Inc. (HNST) income statement, including revenue, profit margins, EPS and key performance metrics. Get detailed insights into the financial performance of The Honest Company, Inc., a leading company in the Specialty Retail industry within the Consumer Cyclical sector.
- EnQuest PLC (ENQ.ST) Income Statement Analysis – Financial Results
- J.B. Hunt Transport Services, Inc. (JBHT) Income Statement Analysis – Financial Results
- Oriental Trimex Limited (ORIENTALTL.BO) Income Statement Analysis – Financial Results
- Morgan Stanley (MS-PI) Income Statement Analysis – Financial Results
- Intertek Group plc (IKTSF) Income Statement Analysis – Financial Results
The Honest Company, Inc. (HNST)
About The Honest Company, Inc.
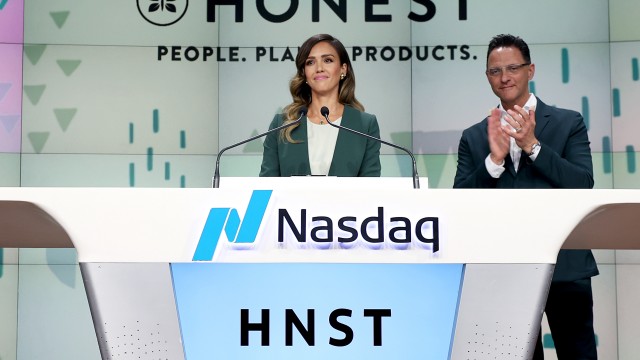
The Honest Company, Inc. manufactures and sells diapers and wipes, skin and personal care, and household and wellness products. The company also offers baby clothing and nursery bedding products. It sells its products through digital and retail sales channels, such as its website and third-party ecommerce sites, as well as brick and mortar retailers. The company was incorporated in 2012 and is headquartered in Los Angeles, California.
| Metric | 2023 | 2022 | 2021 | 2020 | 2019 |
|---|---|---|---|---|---|
| Revenue | 344.37M | 313.65M | 318.64M | 300.52M | 235.59M |
| Cost of Revenue | 243.83M | 221.34M | 209.47M | 192.63M | 159.73M |
| Gross Profit | 100.53M | 92.32M | 109.17M | 107.90M | 75.85M |
| Gross Profit Ratio | 29.19% | 29.43% | 34.26% | 35.90% | 32.20% |
| Research & Development | 6.21M | 7.00M | 7.68M | 5.71M | 5.14M |
| General & Administrative | 94.58M | 87.32M | 84.06M | 71.25M | 70.31M |
| Selling & Marketing | 36.44M | 47.78M | 54.26M | 44.48M | 31.86M |
| SG&A | 131.02M | 135.10M | 138.32M | 115.73M | 102.17M |
| Other Expenses | 2.21M | 377.00K | 54.26M | 0.00 | 0.00 |
| Operating Expenses | 139.44M | 142.10M | 146.00M | 121.44M | 107.31M |
| Cost & Expenses | 383.27M | 363.43M | 355.47M | 314.06M | 267.04M |
| Interest Income | 0.00 | 494.00K | 1.68M | 937.00K | 0.00 |
| Interest Expense | 269.00K | 494.00K | 1.78M | 837.00K | 0.00 |
| Depreciation & Amortization | 2.74M | 2.75M | 4.15M | 4.85M | 7.67M |
| EBITDA | -36.15M | -47.03M | -32.68M | -8.69M | -23.79M |
| EBITDA Ratio | -10.50% | -14.99% | -10.26% | -2.89% | -10.10% |
| Operating Income | -38.91M | -49.78M | -36.83M | -13.54M | -31.46M |
| Operating Income Ratio | -11.30% | -15.87% | -11.56% | -4.51% | -13.35% |
| Total Other Income/Expenses | -254.00K | 871.00K | -1.78M | -837.00K | 429.00K |
| Income Before Tax | -39.16M | -48.91M | -38.60M | -14.38M | -31.03M |
| Income Before Tax Ratio | -11.37% | -15.59% | -12.11% | -4.78% | -13.17% |
| Income Tax Expense | 75.00K | 110.00K | 77.00K | 89.00K | 55.00K |
| Net Income | -39.24M | -49.02M | -38.68M | -14.47M | -31.08M |
| Net Income Ratio | -11.39% | -15.63% | -12.14% | -4.81% | -13.19% |
| EPS | -0.42 | -0.53 | -0.54 | -0.16 | -0.34 |
| EPS Diluted | -0.42 | -0.53 | -0.54 | -0.16 | -0.34 |
| Weighted Avg Shares Out | 94.52M | 92.20M | 71.13M | 90.19M | 90.19M |
| Weighted Avg Shares Out (Dil) | 94.52M | 92.20M | 71.13M | 90.19M | 90.19M |

7 of the Best Penny Stocks Under $3 to Buy Right Now

Time For Procter & Gamble (Or A CPG) To Buy The Honest Company

The Honest Company, Inc. (HNST) Q4 2022 Earnings Call Transcript

The Honest Company, founded by actress Jessica Alba, reports wider 4Q loss; shares slide

Honest (HNST) Reports Q4 Loss, Tops Revenue Estimates

The Honest Company Reports Fourth Quarter and Full Year 2022 Financial Results

The Honest Company to Report Fourth Quarter and Full Year 2022 Financial Results on March 16, 2023

The Honest Company to Report Fourth Quarter and Full Year 2022 Financial Results on March 16, 2023

The Honest Company: Potential Profitability A Concern, Reiterating Hold

Here's Why Honest (HNST) Could be Great Choice for a Bottom Fisher
Source: https://incomestatements.info
Category: Stock Reports
