See more : De La Rue plc (DLUEY) Income Statement Analysis – Financial Results
Complete financial analysis of Iberdrola, S.A. (IBDRY) income statement, including revenue, profit margins, EPS and key performance metrics. Get detailed insights into the financial performance of Iberdrola, S.A., a leading company in the Diversified Utilities industry within the Utilities sector.
- Custom Truck One Source, Inc. (CTOS-WT) Income Statement Analysis – Financial Results
- Cerecor Inc. (CERC) Income Statement Analysis – Financial Results
- Beijing Chunlizhengda Medical Instruments Co., Ltd. (1858.HK) Income Statement Analysis – Financial Results
- Betterware de México, S.A.P.I. de C.V. (BWMX) Income Statement Analysis – Financial Results
- OneLife Technologies Corp. (OLMM) Income Statement Analysis – Financial Results
Iberdrola, S.A. (IBDRY)
About Iberdrola, S.A.
Iberdrola, S.A. engages in the generation, transmission, distribution, and supply of electricity in Spain and internationally. It generates and markets electrical power using renewable sources, such as onshore and offshore wind, hydro, solar photovoltaic, combined cycle gas, nuclear, and biomass, as well as through installation of batteries. The company is also involved in the purchase and sale of electricity and gas on wholesale markets; development of green hydrogen projects; and distribution and sale of gas. It has a total installed capacity of 58,320 MW, including 38,138 MW of renewable installed capacity; and operates 1.2 million kilometers of electricity transmission and distribution lines, as well as serves 36.11 million consumers. In addition, the company offers energy storage, heat pumps, self-consumption, and electric vehicles for residential customers; and management of energy facilities, as well as supplies green H2, industrial heat, etc. to industrial customers. Iberdrola, S.A. was founded in 1840 and is headquartered in Bilbao, Spain.
| Metric | 2023 | 2022 | 2021 | 2020 | 2019 | 2018 | 2017 | 2016 | 2015 | 2014 | 2013 | 2012 | 2011 | 2010 | 2009 | 2008 | 2007 | 2006 | 2005 | 2004 | 2003 | 2002 |
|---|---|---|---|---|---|---|---|---|---|---|---|---|---|---|---|---|---|---|---|---|---|---|
| Revenue | 49.34B | 53.95B | 39.11B | 33.15B | 36.44B | 35.08B | 31.26B | 29.22B | 31.42B | 30.03B | 32.81B | 34.20B | 31.65B | 30.43B | 24.56B | 25.20B | 17.47B | 11.02B | 11.74B | 10.27B | 9.45B | 9.58B |
| Cost of Revenue | 26.03B | 33.75B | 22.05B | 17.00B | 20.17B | 19.64B | 17.90B | 16.30B | 18.58B | 17.85B | 20.23B | 21.62B | 19.11B | 18.79B | 13.77B | 15.20B | 9.18B | 5.22B | 6.79B | 5.98B | 5.48B | 5.88B |
| Gross Profit | 23.30B | 20.20B | 17.06B | 16.15B | 16.26B | 15.44B | 13.36B | 12.92B | 12.84B | 12.18B | 12.58B | 12.58B | 12.53B | 11.65B | 10.79B | 10.00B | 8.29B | 5.80B | 4.95B | 4.29B | 3.97B | 3.69B |
| Gross Profit Ratio | 47.23% | 37.44% | 43.62% | 48.71% | 44.63% | 44.00% | 42.75% | 44.21% | 40.88% | 40.55% | 38.33% | 36.78% | 39.60% | 38.27% | 43.93% | 39.69% | 47.46% | 52.65% | 42.14% | 41.82% | 42.04% | 38.57% |
| Research & Development | 384.00M | 363.00M | 337.00M | 293.00M | 280.00M | 266.55M | 246.39M | 211.45M | 200.20M | 0.00 | 0.00 | 0.00 | 0.00 | 0.00 | 0.00 | 0.00 | 0.00 | 0.00 | 0.00 | 0.00 | 0.00 | 0.00 |
| General & Administrative | 4.00B | 3.60B | 2.94B | 2.84B | 2.84B | 2.80B | 2.58B | 2.30B | 2.44B | 2.16B | 2.32B | 2.38B | 0.00 | 1.70B | 1.70B | 1.49B | 1.17B | 1.00B | 805.58M | 806.70M | 0.00 | 0.00 |
| Selling & Marketing | 0.00 | 0.00 | 0.00 | 0.00 | 0.00 | 0.00 | 2.58B | 2.30B | 2.44B | 2.16B | 2.32B | 2.38B | 2.27B | 2.17B | 2.21B | 2.15B | 1.66B | 1.01B | 862.93M | 747.24M | 0.00 | 0.00 |
| SG&A | 4.00B | 3.60B | 2.94B | 2.84B | 2.84B | 2.80B | 2.58B | 2.30B | 2.44B | 2.16B | 2.32B | 2.38B | 2.27B | 2.17B | 2.21B | 2.15B | 1.66B | 1.01B | 862.93M | 1.55B | 0.00 | 0.00 |
| Other Expenses | 9.95B | 8.14B | 6.39B | 7.33B | 7.27B | 6.90B | 4.33B | 3.80B | 3.85B | 3.82B | 3.66B | 3.21B | 5.75B | 2.94B | 2.37B | 2.11B | 1.77B | 1.14B | -379.10M | -7.34M | -31.12M | -61.23M |
| Operating Expenses | 14.33B | 11.74B | 9.32B | 10.18B | 10.11B | 9.70B | 9.49B | 8.40B | 8.73B | 8.14B | 8.30B | 7.97B | 8.03B | 6.82B | 6.28B | 5.74B | 4.59B | 3.15B | 2.68B | 2.28B | 2.15B | 2.13B |
| Cost & Expenses | 40.36B | 45.49B | 31.37B | 27.18B | 30.28B | 29.34B | 27.39B | 24.70B | 27.31B | 25.99B | 28.53B | 29.59B | 27.14B | 25.60B | 20.05B | 20.93B | 13.77B | 8.36B | 9.48B | 8.25B | 7.63B | 8.01B |
| Interest Income | 343.00M | 442.00M | 209.00M | 140.00M | 131.56M | 194.32M | 223.33M | 158.85M | 233.88M | 240.68M | 210.76M | 295.20M | 361.06M | 186.85M | 156.28M | 98.54M | 362.91M | 114.89M | 74.69M | 45.30M | 75.07M | 68.06M |
| Interest Expense | 2.35B | 1.70B | 1.13B | 983.00M | 1.04B | 1.04B | 919.58M | 916.00M | 991.08M | 1.09B | 1.33B | 1.38B | 1.57B | 1.46B | 1.76B | 1.30B | 1.24B | 677.77M | 600.82M | 541.05M | 631.70M | 648.06M |
| Depreciation & Amortization | 5.81B | 4.72B | 4.21B | 4.00B | 3.91B | 3.62B | 3.21B | 3.12B | 3.80B | 3.45B | 5.25B | 3.66B | 3.26B | 2.92B | 2.55B | 2.32B | 1.94B | 1.40B | 1.35B | 1.03B | 789.16M | 792.77M |
| EBITDA | 13.92B | 12.77B | 11.80B | 10.12B | 9.84B | 8.79B | 6.27B | 7.97B | 7.78B | 7.74B | 7.29B | 8.01B | 7.66B | 7.75B | 7.04B | 6.58B | 5.64B | 4.05B | 3.61B | 3.02B | 2.70B | 2.71B |
| EBITDA Ratio | 28.22% | 26.31% | 32.68% | 31.84% | 28.99% | 27.95% | 26.72% | 26.95% | 25.30% | 25.29% | 29.12% | 24.09% | 24.20% | 24.69% | 27.83% | 23.57% | 30.77% | 35.06% | 29.73% | 30.15% | 28.52% | 25.31% |
| Operating Income | 8.97B | 7.98B | 7.34B | 5.54B | 5.88B | 5.44B | 2.71B | 4.55B | 3.83B | 3.94B | 2.43B | 4.38B | 4.51B | 4.83B | 4.51B | 4.26B | 3.70B | 2.65B | 2.26B | 2.02B | 1.82B | 1.56B |
| Operating Income Ratio | 18.19% | 14.80% | 18.77% | 16.70% | 16.13% | 15.51% | 8.68% | 15.59% | 12.19% | 13.12% | 7.42% | 12.80% | 14.23% | 15.87% | 18.36% | 16.91% | 21.17% | 24.09% | 19.27% | 19.66% | 19.29% | 16.33% |
| Total Other Income/Expenses | -1.95B | -1.69B | -1.04B | -511.00M | -1.08B | -1.09B | -686.78M | -807.19M | -842.67M | -739.14M | -1.08B | -1.41B | -1.05B | -988.76M | -851.73M | -397.52M | -598.66M | -268.27M | -304.41M | -261.67M | -548.16M | -291.57M |
| Income Before Tax | 7.03B | 6.29B | 6.30B | 5.05B | 4.79B | 4.35B | 2.03B | 3.75B | 2.99B | 3.20B | 1.19B | 3.08B | 3.45B | 3.84B | 3.66B | 3.86B | 3.10B | 2.39B | 1.96B | 1.76B | 1.28B | 1.27B |
| Income Before Tax Ratio | 14.24% | 11.66% | 16.11% | 15.25% | 13.16% | 12.40% | 6.48% | 12.83% | 9.51% | 10.66% | 3.63% | 8.99% | 10.92% | 12.62% | 14.89% | 15.34% | 17.74% | 21.66% | 16.68% | 17.11% | 13.49% | 13.29% |
| Income Tax Expense | 1.61B | 1.16B | 1.91B | 1.08B | 914.02M | 959.50M | -1.40B | 904.62M | 527.09M | 837.05M | -1.42B | 206.54M | 549.18M | 899.27M | 718.77M | 895.31M | 702.79M | 695.29M | 553.25M | 534.53M | 207.12M | 304.03M |
| Net Income | 4.80B | 4.34B | 3.89B | 3.61B | 3.41B | 3.01B | 2.80B | 2.73B | 2.44B | 2.35B | 2.60B | 2.84B | 2.80B | 2.87B | 2.82B | 2.86B | 2.35B | 1.66B | 1.38B | 1.21B | 1.06B | 962.57M |
| Net Income Ratio | 9.74% | 8.04% | 9.93% | 10.89% | 9.35% | 8.59% | 8.97% | 9.34% | 7.78% | 7.82% | 7.92% | 8.31% | 8.86% | 9.43% | 11.50% | 11.35% | 13.47% | 15.07% | 11.77% | 11.79% | 11.22% | 10.05% |
| EPS | 0.75 | 0.65 | 0.60 | 0.56 | 0.52 | 0.45 | 0.42 | 0.41 | 0.37 | 0.36 | 0.40 | 0.43 | 0.46 | 0.51 | 0.53 | 0.58 | 0.53 | 0.46 | 0.38 | 0.33 | 0.29 | 0.27 |
| EPS Diluted | 0.74 | 0.65 | 0.60 | 0.56 | 0.52 | 0.45 | 0.42 | 0.41 | 0.37 | 0.36 | 0.40 | 0.43 | 0.46 | 0.51 | 0.53 | 0.58 | 0.53 | 0.46 | 0.38 | 0.33 | 0.29 | 1.48M |
| Weighted Avg Shares Out | 6.43B | 6.66B | 6.44B | 6.44B | 6.67B | 6.74B | 6.68B | 6.63B | 6.35B | 6.49B | 6.49B | 6.43B | 6.12B | 5.60B | 5.31B | 4.89B | 4.48B | 3.60B | 3.60B | 3.60B | 3.60B | 3.60B |
| Weighted Avg Shares Out (Dil) | 6.45B | 6.67B | 6.45B | 6.45B | 6.69B | 6.74B | 6.68B | 6.63B | 6.58B | 6.49B | 6.49B | 6.43B | 6.12B | 5.60B | 5.31B | 4.89B | 4.48B | 3.60B | 3.60B | 3.60B | 3.60B | 649.11 |

Iberdrola Taps ABL for MWS Services on German Offshore Wind Project

IBDRY or WEC: Which Is the Better Value Stock Right Now?

Iberdrola S.A. (IBDSF) Q3 2024 Earnings Call Transcript

Iberdrola profits buoyed by Scottish Power as UK focus intensifies

Iberdrola's profit jumps 50% on record investments

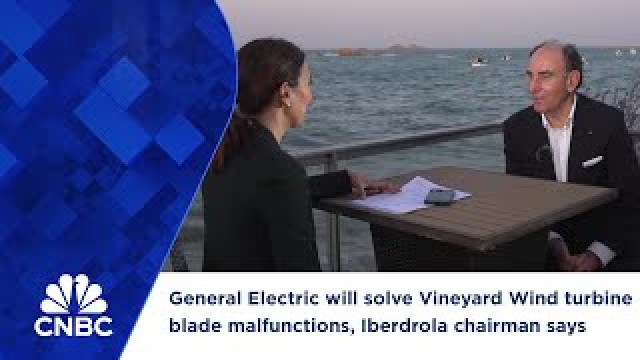
General Electric will solve Vineyard Wind turbine blade malfunctions, Iberdrola chairman says

'Grid is crucial' and the U.S., UK are pushing us to invest more, Iberdrola chairman says

Plug Contracts with bp and Iberdrola Joint Venture to Supply 25 MW of PEM Electrolyzers for bp's Castellón Refinery Project in Valencia, Spain

Qatar mulls increasing its stake in Iberdrola, Expansion reports

Iberdrola, BP to build 25-MW green hydrogen project in Spain
Source: https://incomestatements.info
Category: Stock Reports
