See more : Amiad Water Systems Ltd. (AFS.L) Income Statement Analysis – Financial Results
Complete financial analysis of Iberdrola, S.A. (IBDRY) income statement, including revenue, profit margins, EPS and key performance metrics. Get detailed insights into the financial performance of Iberdrola, S.A., a leading company in the Diversified Utilities industry within the Utilities sector.
- CEL-SCI Corporation (CVM) Income Statement Analysis – Financial Results
- China Haisum Engineering Co., Ltd. (002116.SZ) Income Statement Analysis – Financial Results
- Cofle S.p.A. (CFL.MI) Income Statement Analysis – Financial Results
- GSR II Meteora Acquisition Corp. (GSRMR) Income Statement Analysis – Financial Results
- Quality Industrial Corp. (QIND) Income Statement Analysis – Financial Results
Iberdrola, S.A. (IBDRY)
About Iberdrola, S.A.
Iberdrola, S.A. engages in the generation, transmission, distribution, and supply of electricity in Spain and internationally. It generates and markets electrical power using renewable sources, such as onshore and offshore wind, hydro, solar photovoltaic, combined cycle gas, nuclear, and biomass, as well as through installation of batteries. The company is also involved in the purchase and sale of electricity and gas on wholesale markets; development of green hydrogen projects; and distribution and sale of gas. It has a total installed capacity of 58,320 MW, including 38,138 MW of renewable installed capacity; and operates 1.2 million kilometers of electricity transmission and distribution lines, as well as serves 36.11 million consumers. In addition, the company offers energy storage, heat pumps, self-consumption, and electric vehicles for residential customers; and management of energy facilities, as well as supplies green H2, industrial heat, etc. to industrial customers. Iberdrola, S.A. was founded in 1840 and is headquartered in Bilbao, Spain.
| Metric | 2023 | 2022 | 2021 | 2020 | 2019 | 2018 | 2017 | 2016 | 2015 | 2014 | 2013 | 2012 | 2011 | 2010 | 2009 | 2008 | 2007 | 2006 | 2005 | 2004 | 2003 | 2002 |
|---|---|---|---|---|---|---|---|---|---|---|---|---|---|---|---|---|---|---|---|---|---|---|
| Revenue | 49.34B | 53.95B | 39.11B | 33.15B | 36.44B | 35.08B | 31.26B | 29.22B | 31.42B | 30.03B | 32.81B | 34.20B | 31.65B | 30.43B | 24.56B | 25.20B | 17.47B | 11.02B | 11.74B | 10.27B | 9.45B | 9.58B |
| Cost of Revenue | 26.03B | 33.75B | 22.05B | 17.00B | 20.17B | 19.64B | 17.90B | 16.30B | 18.58B | 17.85B | 20.23B | 21.62B | 19.11B | 18.79B | 13.77B | 15.20B | 9.18B | 5.22B | 6.79B | 5.98B | 5.48B | 5.88B |
| Gross Profit | 23.30B | 20.20B | 17.06B | 16.15B | 16.26B | 15.44B | 13.36B | 12.92B | 12.84B | 12.18B | 12.58B | 12.58B | 12.53B | 11.65B | 10.79B | 10.00B | 8.29B | 5.80B | 4.95B | 4.29B | 3.97B | 3.69B |
| Gross Profit Ratio | 47.23% | 37.44% | 43.62% | 48.71% | 44.63% | 44.00% | 42.75% | 44.21% | 40.88% | 40.55% | 38.33% | 36.78% | 39.60% | 38.27% | 43.93% | 39.69% | 47.46% | 52.65% | 42.14% | 41.82% | 42.04% | 38.57% |
| Research & Development | 363.00M | 363.00M | 337.00M | 293.00M | 280.00M | 266.55M | 246.39M | 211.45M | 200.20M | 170.45M | 159.25M | 0.00 | 0.00 | 0.00 | 0.00 | 0.00 | 0.00 | 0.00 | 0.00 | 0.00 | 0.00 | 0.00 |
| General & Administrative | 4.00B | 3.60B | 2.94B | 2.84B | 2.84B | 2.80B | 2.58B | 2.30B | 2.44B | 2.16B | 2.32B | 2.38B | 2.27B | 1.70B | 1.70B | 1.49B | 1.17B | 1.00B | 805.58M | 806.70M | 0.00 | 0.00 |
| Selling & Marketing | 0.00 | 0.00 | 0.00 | 0.00 | 0.00 | 0.00 | 2.58B | 2.30B | 2.44B | 2.16B | 2.32B | 2.38B | 2.27B | 2.17B | 2.21B | 2.15B | 1.66B | 1.01B | 862.93M | 747.24M | 0.00 | 0.00 |
| SG&A | 4.00B | 3.60B | 2.94B | 2.84B | 2.84B | 2.80B | 2.58B | 2.30B | 2.44B | 2.16B | 2.32B | 2.38B | 2.27B | 2.17B | 2.21B | 2.15B | 1.66B | 1.01B | 862.93M | 1.55B | 0.00 | 0.00 |
| Other Expenses | 9.97B | -858.00M | 169.00M | -1.14B | -1.17B | -1.47B | -884.21M | -1.74B | -1.90B | 0.00 | 0.00 | 0.00 | 0.00 | 0.00 | 0.00 | 0.00 | 0.00 | 0.00 | -379.10M | -7.34M | -31.12M | -61.23M |
| Operating Expenses | 14.33B | 11.74B | 9.32B | 10.18B | 10.11B | 9.70B | 9.49B | 8.40B | 8.73B | 8.14B | 8.30B | 7.97B | 8.03B | 6.82B | 6.28B | 5.74B | 4.59B | 3.15B | 2.68B | 2.28B | 2.15B | 2.13B |
| Cost & Expenses | 40.36B | 45.49B | 31.37B | 27.18B | 30.28B | 29.34B | 27.39B | 24.70B | 27.31B | 25.99B | 28.53B | 29.59B | 27.14B | 25.60B | 20.05B | 20.93B | 13.77B | 8.36B | 9.48B | 8.25B | 7.63B | 8.01B |
| Interest Income | 60.00M | 442.00M | 209.00M | 140.00M | 131.56M | 194.32M | 223.33M | 158.85M | 233.88M | 240.68M | 210.76M | 295.20M | 361.06M | 186.85M | 156.28M | 98.54M | 362.91M | 114.89M | 74.69M | 45.30M | 75.07M | 68.06M |
| Interest Expense | 2.07B | 1.70B | 1.13B | 983.00M | 1.04B | 1.04B | 919.58M | 916.00M | 991.08M | 1.09B | 1.33B | 1.38B | 1.38B | 1.44B | 1.27B | 1.30B | 1.24B | 709.20M | 588.52M | 541.05M | 631.70M | 648.06M |
| Depreciation & Amortization | 5.81B | 4.72B | 4.21B | 4.00B | 3.91B | 3.62B | 3.21B | 3.12B | 3.80B | 3.45B | 5.25B | 3.66B | 3.26B | 2.92B | 2.55B | 2.32B | 1.94B | 1.40B | 1.35B | 1.03B | 789.16M | 792.77M |
| EBITDA | 14.91B | 13.48B | 12.52B | 10.69B | 10.37B | 9.47B | 7.91B | 7.87B | 7.78B | 7.74B | 7.29B | 8.01B | 7.66B | 7.75B | 7.04B | 6.58B | 5.64B | 4.05B | 3.61B | 3.02B | 2.70B | 2.71B |
| EBITDA Ratio | 30.21% | 26.31% | 32.68% | 31.84% | 28.99% | 27.95% | 26.72% | 26.95% | 25.30% | 25.29% | 29.12% | 24.09% | 24.20% | 24.69% | 27.83% | 23.57% | 30.77% | 35.06% | 29.73% | 30.15% | 28.52% | 25.31% |
| Operating Income | 8.97B | 7.98B | 7.34B | 5.54B | 5.88B | 5.44B | 2.71B | 4.55B | 3.83B | 3.94B | 2.43B | 4.38B | 4.51B | 4.83B | 4.51B | 4.26B | 3.70B | 2.65B | 2.26B | 2.02B | 1.82B | 1.56B |
| Operating Income Ratio | 18.19% | 14.80% | 18.77% | 16.70% | 16.13% | 15.51% | 8.68% | 15.59% | 12.19% | 13.12% | 7.42% | 12.80% | 14.23% | 15.87% | 18.36% | 16.91% | 21.17% | 24.09% | 19.27% | 19.66% | 19.29% | 16.33% |
| Total Other Income/Expenses | -1.95B | -1.69B | -1.04B | -511.00M | -1.08B | -1.09B | -686.78M | -807.19M | -842.67M | -739.14M | -1.08B | -1.41B | -1.05B | -988.76M | -851.73M | -397.52M | -598.66M | -268.27M | -304.41M | -261.67M | -548.16M | -291.57M |
| Income Before Tax | 7.03B | 6.29B | 6.30B | 5.05B | 4.79B | 4.35B | 2.03B | 3.75B | 2.99B | 3.20B | 1.19B | 3.08B | 3.45B | 3.84B | 3.66B | 3.86B | 3.10B | 2.39B | 1.96B | 1.76B | 1.28B | 1.27B |
| Income Before Tax Ratio | 14.24% | 11.66% | 16.11% | 15.25% | 13.16% | 12.40% | 6.48% | 12.83% | 9.51% | 10.66% | 3.63% | 8.99% | 10.92% | 12.62% | 14.89% | 15.34% | 17.74% | 21.66% | 16.68% | 17.11% | 13.49% | 13.29% |
| Income Tax Expense | 1.61B | 1.16B | 1.91B | 1.08B | 914.02M | 959.50M | -1.40B | 904.62M | 527.09M | 837.05M | -1.42B | 206.54M | 549.18M | 899.27M | 718.77M | 895.31M | 702.79M | 695.29M | 553.25M | 534.53M | 207.12M | 304.03M |
| Net Income | 4.80B | 4.34B | 3.89B | 3.61B | 3.47B | 3.01B | 2.80B | 2.70B | 2.42B | 2.33B | 2.57B | 2.77B | 2.80B | 2.87B | 2.82B | 2.86B | 2.35B | 1.66B | 1.38B | 1.20B | 1.06B | 962.57M |
| Net Income Ratio | 9.74% | 8.04% | 9.93% | 10.89% | 9.51% | 8.59% | 8.97% | 9.26% | 7.71% | 7.75% | 7.84% | 8.08% | 8.86% | 9.43% | 11.50% | 11.35% | 13.47% | 15.07% | 11.77% | 11.64% | 11.22% | 10.05% |
| EPS | 0.72 | 2.74 | 2.85 | 2.56 | 2.33 | 2.20 | 1.89 | 1.81 | 1.69 | 1.90 | 2.15 | 2.22 | 2.68 | 2.72 | 3.10 | 3.43 | 2.90 | 2.31 | 1.90 | 1.66 | 1.18 | 1.07 |
| EPS Diluted | 0.74 | 2.73 | 2.85 | 2.55 | 2.32 | 2.20 | 1.89 | 1.81 | 1.69 | 1.90 | 2.15 | 2.22 | 2.68 | 2.72 | 3.10 | 3.43 | 2.90 | 2.31 | 1.90 | 1.66 | 1.18 | 1.07 |
| Weighted Avg Shares Out | 6.70B | 1.66B | 1.61B | 1.61B | 1.67B | 1.61B | 1.67B | 1.66B | 1.59B | 1.62B | 1.59B | 1.61B | 1.45B | 1.40B | 1.27B | 1.22B | 1.12B | 901.06M | 900.99M | 900.12M | 899.72M | 899.72M |
| Weighted Avg Shares Out (Dil) | 6.45B | 1.67B | 1.61B | 1.61B | 1.67B | 1.61B | 1.67B | 1.66B | 1.59B | 1.62B | 1.59B | 1.61B | 1.45B | 1.40B | 1.27B | 1.22B | 1.12B | 901.06M | 900.99M | 900.12M | 899.72M | 899.72M |
Iberdrola: Looking Forward To Its Capital Market Day

Iberdrola, S.A. (IBDSF) Q3 2022 Earnings Call Transcript
Iberdrola backs profit guidance after 9 month earnings rise
BP, Iberdrola commit €1bn to EV charging, partner on green hydrogen

Iberdrola S.A. (IBDSF) CEO Ignacio Galan on Q2 2022 Results - Earnings Call Transcript
Iberdrola: One Of The Greenest Utilities Is On Sale, ~20% Discount To Intrinsic Value
SSE, Iberdrola and Engie among winners from the government's latest power auction
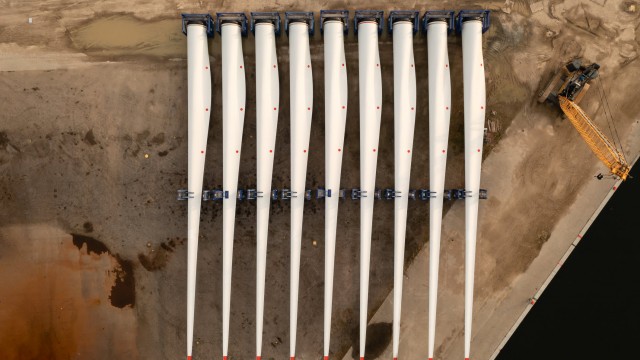
GE, Orsted and now Iberdrola: The competition to recycle wind turbine blades hots up

Iberdrola S.A. (IBDSF) CEO Ignacio Galan on Q1 2022 Results - Earnings Call Transcript
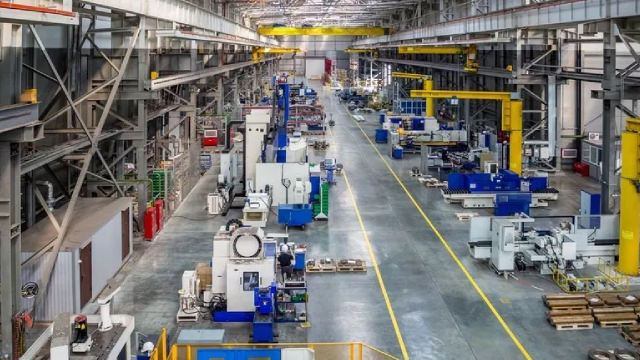
General Electric (GE) Arm Wins Wind Turbine Deal From Iberdrola
Source: https://incomestatements.info
Category: Stock Reports
