See more : Nexxen International Ltd. (TTTPF) Income Statement Analysis – Financial Results
Complete financial analysis of ICC Holdings, Inc. (ICCH) income statement, including revenue, profit margins, EPS and key performance metrics. Get detailed insights into the financial performance of ICC Holdings, Inc., a leading company in the Insurance – Specialty industry within the Financial Services sector.
- Ursus S.A. (URS.WA) Income Statement Analysis – Financial Results
- Gequity S.p.A. (GEQ.MI) Income Statement Analysis – Financial Results
- Zhejiang Meorient Commerce Exhibition Inc. (300795.SZ) Income Statement Analysis – Financial Results
- Abcourt Mines Inc. (ABI.V) Income Statement Analysis – Financial Results
- Subsea 7 S.A. (ACGYF) Income Statement Analysis – Financial Results
ICC Holdings, Inc. (ICCH)
About ICC Holdings, Inc.
ICC Holdings, Inc., together with its subsidiaries, provides property and casualty insurance products to the food and beverage industry in the United States. The company offers commercial multi-peril, liquor liability, workers' compensation, and umbrella liability insurance products. It markets its products through a network of 186 independent agents in Arizona, Colorado, Illinois, Indiana, Iowa, Kansas, Minnesota, Michigan, Missouri, Ohio, Oregon, Pennsylvania, Tennessee, Utah, and Wisconsin. ICC Holdings, Inc. was founded in 1950 and is headquartered in Rock Island, Illinois.
| Metric | 2023 | 2022 | 2021 | 2020 | 2019 | 2018 | 2017 | 2016 | 2015 | 2014 |
|---|---|---|---|---|---|---|---|---|---|---|
| Revenue | 82.94M | 69.68M | 61.44M | 54.88M | 59.52M | 51.16M | 48.18M | 44.87M | 41.82M | 39.83M |
| Cost of Revenue | 1.78B | 1.73B | 1.68B | 1.44B | 1.75B | 18.21B | 17.31B | 0.00 | 0.00 | 0.00 |
| Gross Profit | -1.70B | -1.66B | -1.62B | -1.39B | -1.69B | -18.16B | -17.26B | 44.87M | 41.82M | 39.83M |
| Gross Profit Ratio | -2,047.77% | -2,386.35% | -2,629.37% | -2,523.84% | -2,838.53% | -35,501.39% | -35,824.37% | 100.00% | 100.00% | 100.00% |
| Research & Development | 0.00 | 0.00 | 0.00 | 0.00 | 0.00 | 0.00 | 0.00 | 0.00 | 0.00 | 0.00 |
| General & Administrative | 784.31K | 776.75K | 723.35K | 641.76K | 579.71K | 545.99K | 555.11K | 464.38K | 314.12K | 263.48K |
| Selling & Marketing | 0.00 | 0.00 | 0.00 | 0.00 | 0.00 | 0.00 | 0.00 | 0.00 | 0.00 | 0.00 |
| SG&A | 784.31K | 776.75K | 723.35K | 641.76K | 579.71K | 545.99K | 555.11K | 464.38K | 314.12K | 263.48K |
| Other Expenses | 82.16M | 1.77M | -57.55M | -50.71M | -54.97M | -50.57M | 17.26B | -41.35M | -39.12M | -37.73M |
| Operating Expenses | 82.94M | 1.77M | -56.83M | -50.07M | -54.39M | -50.02M | 17.26B | -40.88M | -38.81M | -37.47M |
| Cost & Expenses | 82.94M | 70.40M | 56.48M | 50.30M | 54.44M | 50.16M | 47.09M | 40.88M | 38.81M | 37.47M |
| Interest Income | 0.00 | 196.07K | 235.00K | 207.72K | 128.79K | 0.00 | 0.00 | 0.00 | 2.33M | 2.15M |
| Interest Expense | 184.12K | 196.07K | 235.00K | 207.72K | 128.79K | 140.88K | 225.38K | 226.10K | 136.30K | 133.78K |
| Depreciation & Amortization | 763.82K | 693.07K | 708.38K | 684.74K | 794.51K | 733.49K | 822.62K | 817.77K | 505.56K | 511.29K |
| EBITDA | 6.47M | 167.31K | 5.32M | 5.47M | 5.93M | 1.87M | 2.13M | 5.03M | 3.66M | 3.01M |
| EBITDA Ratio | 7.80% | -0.75% | 8.65% | 10.01% | 9.96% | 3.66% | 4.42% | 11.21% | 8.75% | 7.56% |
| Operating Income | 0.00 | -1.22M | 4.61M | 4.81M | 5.13M | 1.14M | 1.09M | 3.99M | 3.02M | 2.36M |
| Operating Income Ratio | 0.00% | -1.75% | 7.50% | 8.76% | 8.63% | 2.23% | 2.26% | 8.89% | 7.21% | 5.94% |
| Total Other Income/Expenses | 5.52M | -196.07K | 1.56B | 1.43M | 1.65B | -140.88K | -225.38K | -226.10K | -136.30K | -133.78K |
| Income Before Tax | 5.52M | -721.83K | 4.96M | 4.58M | 5.08M | 999.38K | 1.09M | 3.99M | 3.02M | 2.36M |
| Income Before Tax Ratio | 6.66% | -1.04% | 8.07% | 8.34% | 8.54% | 1.95% | 2.26% | 8.89% | 7.21% | 5.94% |
| Income Tax Expense | 1.27M | -250.48K | 667.73K | 1.05M | 787.22K | 106.09K | 372.29K | 1.18M | 861.74K | 779.15K |
| Net Income | 4.26M | -471.34K | 4.14M | 3.53M | 4.29M | 893.30K | 716.76K | 2.81M | 2.15M | 1.59M |
| Net Income Ratio | 5.13% | -0.68% | 6.74% | 6.43% | 7.21% | 1.75% | 1.49% | 6.26% | 5.15% | 3.98% |
| EPS | 1.44 | -0.16 | 1.36 | 1.17 | 1.43 | 0.29 | 0.22 | 0.80 | 0.62 | 0.45 |
| EPS Diluted | 1.43 | -0.16 | 1.35 | 1.16 | 1.42 | 0.29 | 0.22 | 0.80 | 0.62 | 0.45 |
| Weighted Avg Shares Out | 2.95M | 3.03M | 3.05M | 3.03M | 3.01M | 3.12M | 3.16M | 3.50M | 3.50M | 3.50M |
| Weighted Avg Shares Out (Dil) | 2.97M | 3.03M | 3.07M | 3.04M | 3.01M | 3.12M | 3.16M | 3.50M | 3.50M | 3.50M |
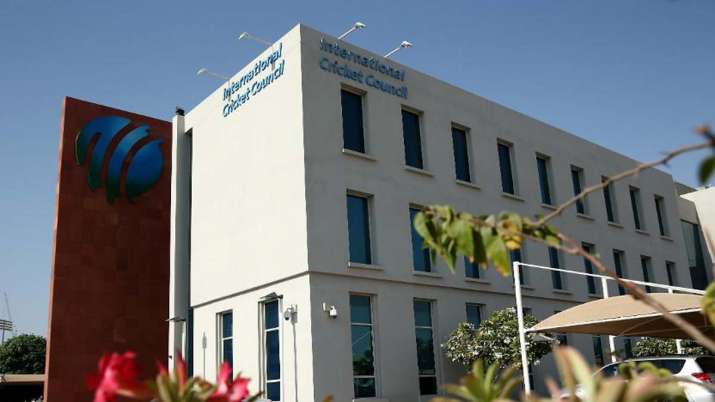
ICC chairman election: No decision taken in board meeting as members search for unanimous candidate
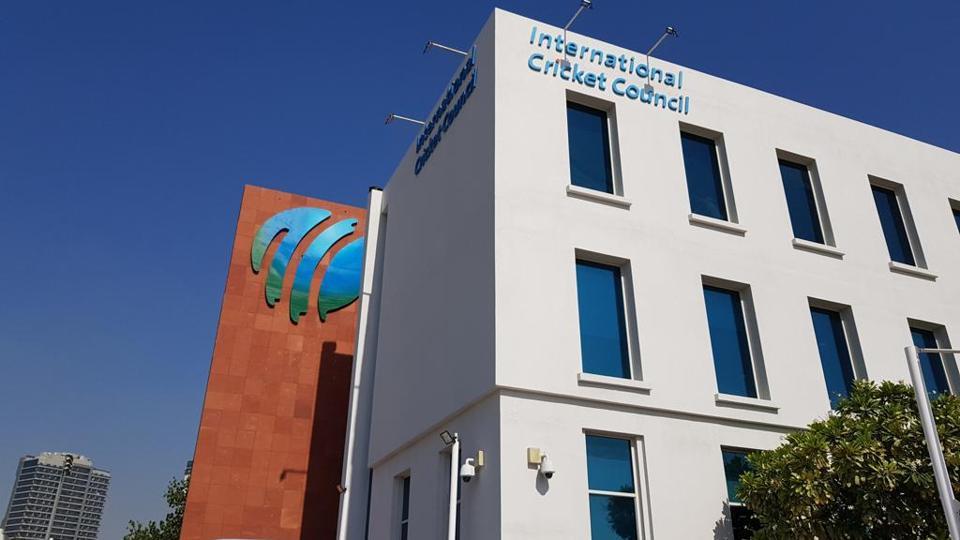
ICC meet: No decision taken as members search for unanimous candidate

New guidance for protecting migrant workers during the coronavirus pandemic

Protecting migrant workers during the coronavirus pandemic

ENG vs PAK: Shan Masood, Chris Woakes, Jos Buttler move up in ICC's Test Player Rankings

Heather Knight 'gutted' by 2021 Women's World Cup postponement: It was feasible in New Zealand
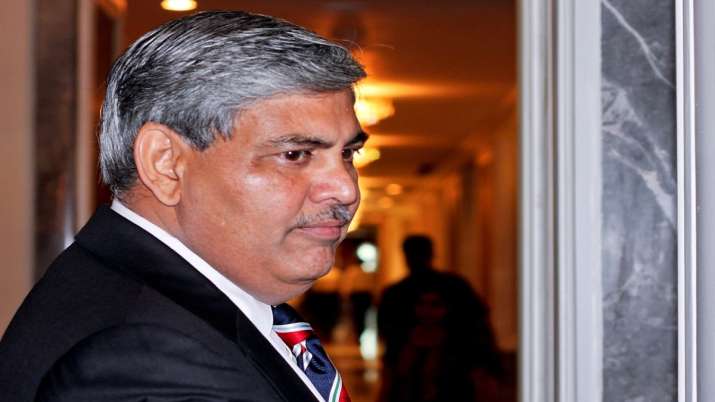
ICC Board Meet: Finalising nomination process to elect Shashank Manohar's successor sole agenda
ICC board meet: Nomination process to elect Shashank Manohar's successor only agenda
ICC Board Meet: Nomination Process to Replace Shashank Manohar the Sole Agenda
Source: https://incomestatements.info
Category: Stock Reports

