See more : Gattaca plc (GATC.L) Income Statement Analysis – Financial Results
Complete financial analysis of IperionX Limited (IPX) income statement, including revenue, profit margins, EPS and key performance metrics. Get detailed insights into the financial performance of IperionX Limited, a leading company in the Industrial Materials industry within the Basic Materials sector.
- Sonec Corporation (1768.T) Income Statement Analysis – Financial Results
- Elegant Home-Tech Co., Ltd. (603221.SS) Income Statement Analysis – Financial Results
- Ascendant Resources Inc. (ASND.TO) Income Statement Analysis – Financial Results
- Central Development Holdings Limited (0475.HK) Income Statement Analysis – Financial Results
- GoGreen Investments Corporation (GOGN-UN) Income Statement Analysis – Financial Results
IperionX Limited (IPX)
About IperionX Limited
IperionX Limited engages in the exploration and development of mineral properties. It explores for epithermal and replacement style precious and base metal mineralization, as well as titanium, rare earth elements, silica sand, and zircon minerals. The company holds a 100% interest in the Milford project that includes 101 claims located in Utah, the United States. It also holds a 100% interest in Titan project covering an area of approximately 6,000 acres situated in Tennessee, the United States. The company was formerly known as Hyperion Metals Limited and changed its name to IperionX Limited in February 2022. IperionX Limited was incorporated in 2017 and is headquartered in Charlotte, North Carolina.
| Metric | 2024 | 2023 | 2022 | 2021 | 2020 | 2019 | 2018 | 2017 |
|---|---|---|---|---|---|---|---|---|
| Revenue | 0.00 | 0.00 | 0.00 | 0.00 | 0.00 | 0.00 | 0.00 | 0.00 |
| Cost of Revenue | 657.16K | 634.11K | 211.58K | 9.38K | 22.73K | 0.00 | 0.00 | 0.00 |
| Gross Profit | -657.16K | -634.11K | -211.58K | -9.38K | -22.73K | 0.00 | 0.00 | 0.00 |
| Gross Profit Ratio | 0.00% | 0.00% | 0.00% | 0.00% | 0.00% | 0.00% | 0.00% | 0.00% |
| Research & Development | 8.87M | 8.33M | 3.21M | 180.19K | 0.00 | 0.00 | 0.00 | 0.00 |
| General & Administrative | 0.00 | 6.58M | 11.40M | 3.71M | 365.91K | 398.37K | 711.26K | 0.00 |
| Selling & Marketing | 0.00 | 10.72M | 0.00 | 0.00 | 0.00 | 0.00 | 0.00 | 0.00 |
| SG&A | 13.49M | 17.30M | 11.40M | 3.71M | 365.91K | 398.37K | 711.26K | 73.55K |
| Other Expenses | 0.00 | 60.47K | 0.00 | -3.86M | 17.79K | 0.00 | 0.00 | 0.00 |
| Operating Expenses | 22.36M | 25.62M | 21.87M | 9.93M | 381.53K | 398.37K | 711.26K | 73.55K |
| Cost & Expenses | 23.01M | 26.26M | 21.87M | 9.93M | 381.53K | 398.37K | 711.26K | 73.55K |
| Interest Income | 555.59K | 207.68K | 24.04K | 3.81K | 10.78K | 21.58K | 1.62K | 0.00 |
| Interest Expense | 124.88K | 131.03K | 45.54K | 5.62K | 3.31K | 0.00 | 0.00 | 0.00 |
| Depreciation & Amortization | 657.16K | 634.11K | 211.58K | 9.38K | 22.73K | 120.14K | 118.61K | 40.20K |
| EBITDA | -21.44M | -25.62M | -29.39M | -13.30M | -490.94K | -398.37K | -711.26K | -73.56K |
| EBITDA Ratio | 0.00% | 0.00% | 0.00% | 0.00% | 0.00% | 0.00% | 0.00% | 0.00% |
| Operating Income | -23.01M | -26.26M | -21.85M | -9.93M | -352.96K | -398.37K | -711.26K | -73.56K |
| Operating Income Ratio | 0.00% | 0.00% | 0.00% | 0.00% | 0.00% | 0.00% | 0.00% | 0.00% |
| Total Other Income/Expenses | 787.17K | 322.31K | 480.94K | -3.39M | 38.28K | -139.64K | 2.21K | 2.30 |
| Income Before Tax | -22.23M | -25.93M | -21.52M | -9.93M | -355.23K | -376.79K | -709.64K | -73.55K |
| Income Before Tax Ratio | 0.00% | 0.00% | 0.00% | 0.00% | 0.00% | 0.00% | 0.00% | 0.00% |
| Income Tax Expense | 912.05K | -2.00 | 45.54K | -9.38K | 20.06K | -120.14K | -118.61K | -40.20K |
| Net Income | -22.23M | -25.93M | -21.52M | -9.93M | -355.23K | -376.79K | -709.64K | -73.55K |
| Net Income Ratio | 0.00% | 0.00% | 0.00% | 0.00% | 0.00% | 0.00% | 0.00% | 0.00% |
| EPS | -0.10 | -0.15 | -0.16 | -0.08 | 0.00 | 0.00 | -0.01 | -0.31 |
| EPS Diluted | -0.10 | -0.15 | -0.16 | -0.08 | 0.00 | 0.00 | -0.01 | -0.31 |
| Weighted Avg Shares Out | 217.84M | 168.03M | 134.61M | 132.03M | 132.03M | 132.03M | 132.03M | 237.50K |
| Weighted Avg Shares Out (Dil) | 217.84M | 168.03M | 134.61M | 132.03M | 132.03M | 132.03M | 132.03M | 237.50K |

IperionX Receives Key Permits for Development of the Titanium & Rare Earth Mineral Rich Titan Project

IperionX Receives Key Permits for Titanium Metal Production in Virginia

IperionX and Aperam Recycling Partner to Create 100% Recycled Titanium Supply Chain
IperionX Plans to Build the World’s Largest 100% Recycled Titanium Metal Powder Facility By 2025
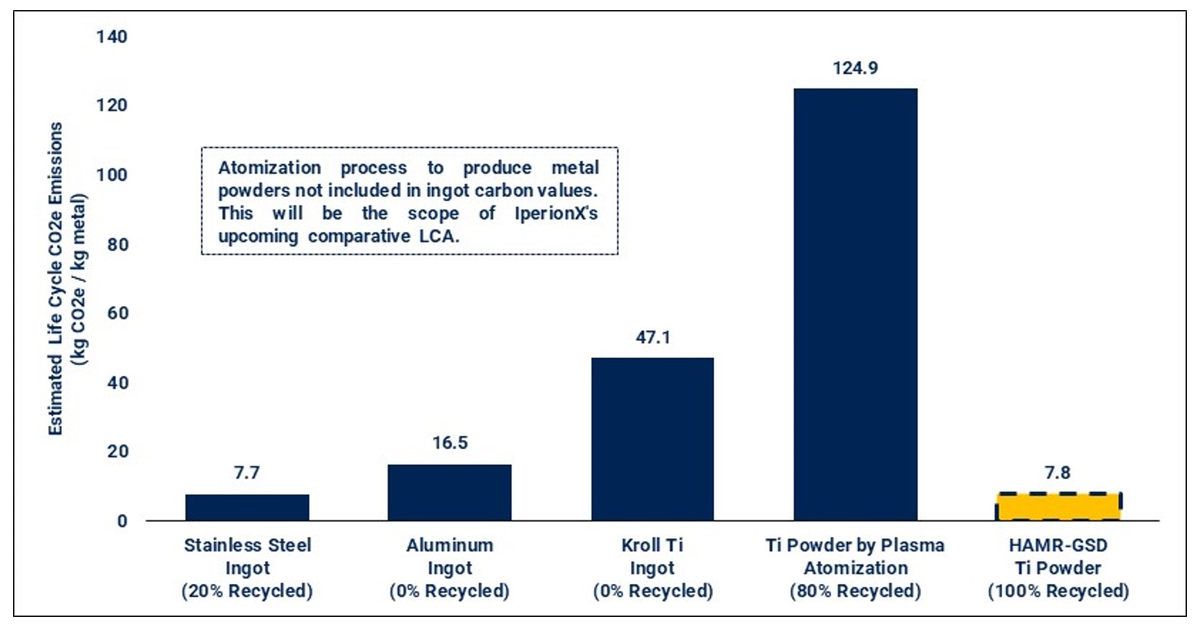
IperionX Releases Life Cycle Assessment of 100% Recycled Titanium Powder
IperionX Green Hydrogen Market Assessment
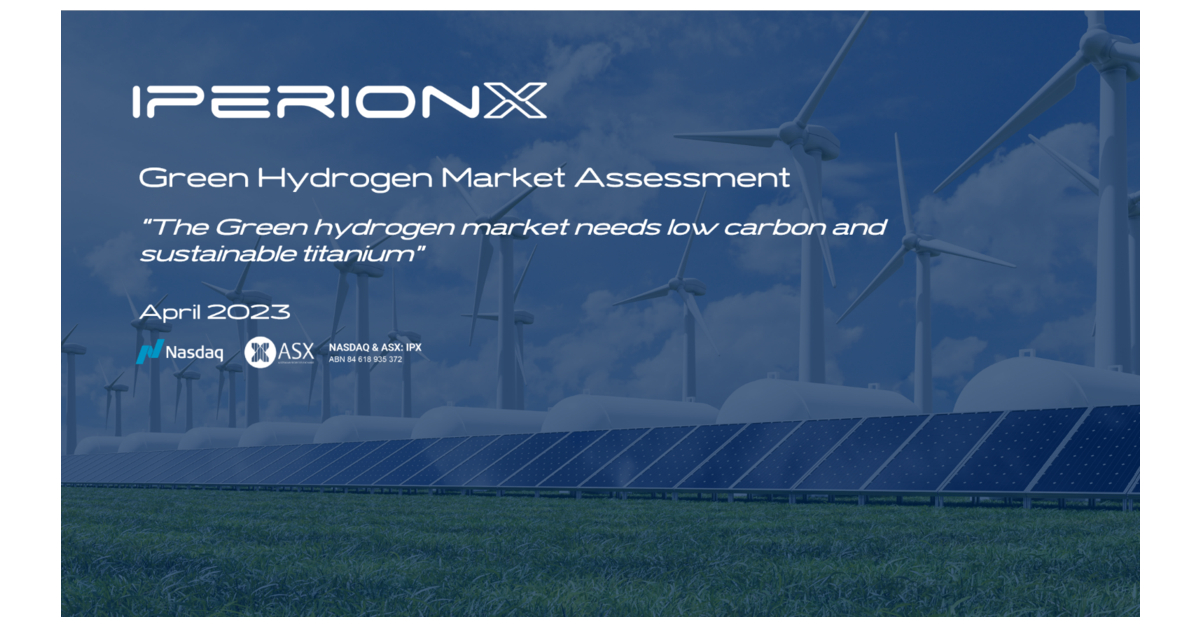
IperionX Green Hydrogen Market Assessment
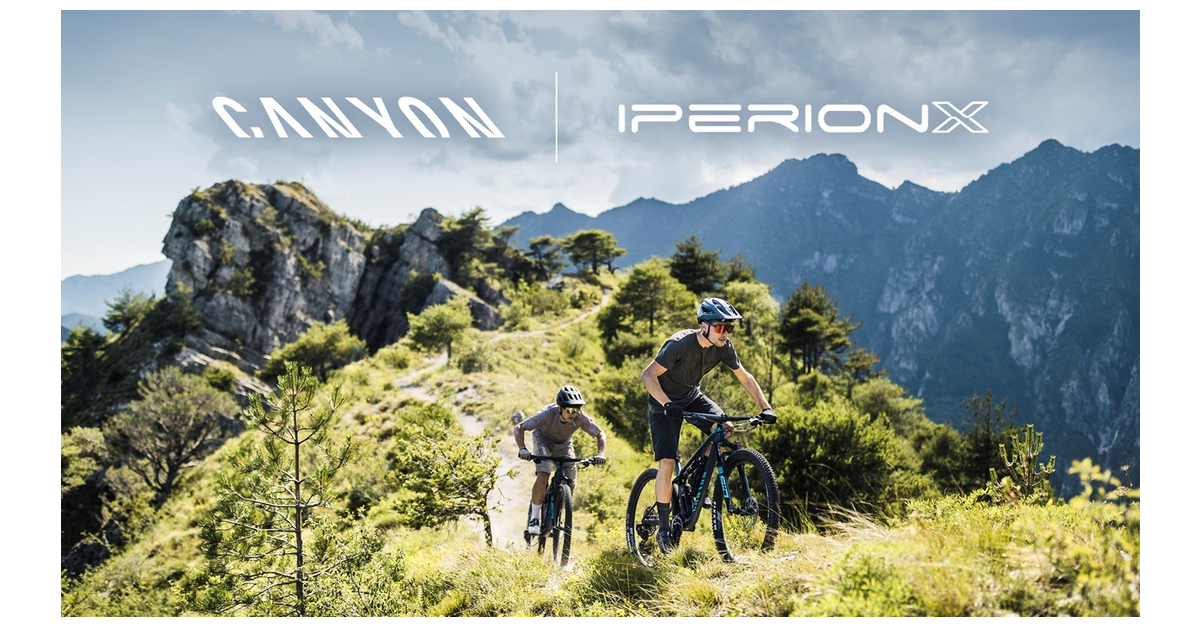
IperionX & Canyon Bicycles Partner to Implement Sustainability Improvements in the Bicycle Industry Supply Chain
IperionX and SLM Solutions Announce MOU
IperionX Appoints Harold Sears as Additive Manufacturing Senior Advisor
Source: https://incomestatements.info
Category: Stock Reports
