See more : G N A Axles Limited (GNA.BO) Income Statement Analysis – Financial Results
Complete financial analysis of IT Tech Packaging, Inc. (ITP) income statement, including revenue, profit margins, EPS and key performance metrics. Get detailed insights into the financial performance of IT Tech Packaging, Inc., a leading company in the Paper, Lumber & Forest Products industry within the Basic Materials sector.
- SILK Laser Australia Limited (SLA.AX) Income Statement Analysis – Financial Results
- Reve Technologies, Inc. (BSSP) Income Statement Analysis – Financial Results
- Golkonda Aluminium Extrusions Limited (GOLKONDA.BO) Income Statement Analysis – Financial Results
- Starr Peak Mining Ltd. (STRPF) Income Statement Analysis – Financial Results
- MRT Inc. (6034.T) Income Statement Analysis – Financial Results
IT Tech Packaging, Inc. (ITP)
About IT Tech Packaging, Inc.
IT Tech Packaging, Inc., through its subsidiaries, engages in the production and distribution of paper products in the People's Republic of China. The company offers corrugating medium papers to companies making corrugating cardboards; and offset printing papers to printing companies. It also provides tissue paper products, including toilet papers, boxed and soft-packed tissues, handkerchief tissues, and paper napkins, as well as bathroom and kitchen paper towels under the Dongfang Paper brand. In addition, the company produces and sells non-medical single-use face masks, and medical face masks. The company was formerly known as Orient Paper, Inc. and changed its name to IT Tech Packaging, Inc. in August 2018. IT Tech Packaging, Inc. was founded in 1996 and is headquartered in Baoding, the People's' Republic of China.
| Metric | 2023 | 2022 | 2021 | 2020 | 2019 | 2018 | 2017 | 2016 | 2015 | 2014 | 2013 | 2012 | 2011 | 2010 | 2009 | 2008 | 2007 | 2006 |
|---|---|---|---|---|---|---|---|---|---|---|---|---|---|---|---|---|---|---|
| Revenue | 86.55M | 100.35M | 160.88M | 100.94M | 117.61M | 86.75M | 117.02M | 134.74M | 135.30M | 137.04M | 125.72M | 151.12M | 150.75M | 123.99M | 102.14M | 65.20M | 39.71M | 30.56M |
| Cost of Revenue | 85.55M | 95.60M | 149.86M | 95.24M | 103.94M | 80.93M | 97.07M | 109.21M | 107.44M | 114.26M | 102.39M | 124.06M | 117.80M | 97.81M | 82.11M | 52.64M | 33.10M | 25.23M |
| Gross Profit | 999.89K | 4.75M | 11.02M | 5.70M | 13.68M | 5.82M | 19.96M | 25.53M | 27.86M | 22.78M | 23.33M | 27.06M | 32.95M | 26.18M | 20.04M | 12.56M | 6.61M | 5.33M |
| Gross Profit Ratio | 1.16% | 4.74% | 6.85% | 5.65% | 11.63% | 6.71% | 17.05% | 18.95% | 20.59% | 16.62% | 18.55% | 17.90% | 21.86% | 21.11% | 19.61% | 19.26% | 16.64% | 17.44% |
| Research & Development | 90.77K | 145.54K | 101.41K | 69.21K | 74.83K | 30.19K | 31.92K | 21.60K | 28.45K | 20.28K | 25.13K | 21.64K | 0.00 | 0.00 | 0.00 | 0.00 | 0.00 | 0.00 |
| General & Administrative | 0.00 | 0.00 | 0.00 | 0.00 | 0.00 | 0.00 | 11.31M | 0.00 | 0.00 | 0.00 | 0.00 | 0.00 | 0.00 | 0.00 | 0.00 | 0.00 | 273.94K | 292.83K |
| Selling & Marketing | 0.00 | 0.00 | 0.00 | 0.00 | 0.00 | 0.00 | 0.00 | 0.00 | 0.00 | 0.00 | 0.00 | 0.00 | 0.00 | 0.00 | 0.00 | 0.00 | 0.00 | 0.00 |
| SG&A | 8.98M | 10.06M | 9.56M | 11.16M | 9.78M | 13.10M | 11.31M | 12.40M | 9.66M | 4.86M | 4.57M | 3.36M | 2.52M | 3.07M | 2.03M | 327.83K | 273.94K | 292.83K |
| Other Expenses | 0.00 | 0.00 | -198.53K | -220.48K | -261.14K | 241.19K | 41.53K | 0.00 | 555.61K | 22.61K | 171.13K | 0.00 | 0.00 | 1.12M | 0.00 | 0.00 | 0.00 | 0.00 |
| Operating Expenses | 9.08M | 10.06M | 9.36M | 10.94M | 9.52M | 12.86M | 11.27M | 12.40M | 9.11M | 4.84M | 4.40M | 3.36M | 2.52M | 4.19M | 2.03M | 327.83K | 273.94K | 292.83K |
| Cost & Expenses | 94.62M | 105.66M | 159.22M | 106.18M | 113.46M | 93.78M | 108.33M | 121.61M | 116.55M | 119.10M | 106.79M | 127.42M | 120.31M | 102.00M | 84.14M | 52.97M | 33.37M | 25.52M |
| Interest Income | 315.10K | 24.26K | 38.77K | 32.03K | 64.72K | 36.63K | 34.59K | 96.98K | 70.32K | 149.78K | 90.26K | 30.67K | 36.44K | 163.18K | 108.61K | 65.32K | 3.35K | 0.00 |
| Interest Expense | 984.52K | 1.03M | 1.12M | 1.03M | 926.37K | 1.49M | 2.43M | 2.62M | 3.16M | 1.45M | 995.69K | 871.83K | 699.89K | 633.01K | 728.43K | 598.47K | 272.20K | 275.23K |
| Depreciation & Amortization | 14.23M | 14.79M | 15.36M | 15.79M | 15.30M | 14.29M | 14.63M | 15.29M | 13.40M | 8.29M | 7.79M | 8.38M | 4.42M | 4.15M | 3.51M | 3.84M | 2.95M | 1.87M |
| EBITDA | 5.61M | 10.96M | 22.94M | 10.16M | 19.53M | 3.39M | 19.39M | 28.34M | 32.22M | 25.87M | 26.90M | 29.39M | 34.57M | 26.30M | 21.62M | 16.14M | 9.29M | 8.98K |
| EBITDA Ratio | 6.48% | 9.47% | 10.60% | 10.49% | 16.60% | 8.40% | 19.96% | 21.16% | 23.81% | 19.25% | 21.33% | 21.25% | 23.15% | 21.21% | 21.17% | 24.75% | 23.39% | 22.61% |
| Operating Income | -9.58M | -5.28M | 1.46M | -5.20M | 3.90M | -11.18M | 4.68M | 12.95M | 18.20M | 17.41M | 18.84M | 20.98M | 30.11M | 21.99M | 18.01M | 12.23M | 6.33M | 5.04M |
| Operating Income Ratio | -11.06% | -5.26% | 0.91% | -5.15% | 3.31% | -12.89% | 4.00% | 9.61% | 13.45% | 12.71% | 14.99% | 13.88% | 19.97% | 17.73% | 17.63% | 18.76% | 15.95% | 16.49% |
| Total Other Income/Expenses | -23.19K | 444.56K | 4.99M | -1.20M | -600.52K | -5.12M | -6.33M | -2.70M | -2.53M | -1.78M | -649.34K | -841.49K | -984.66K | -469.83K | -619.82K | -533.16K | -272.20K | -8.98K |
| Income Before Tax | -9.60M | -4.86M | 6.45M | -6.66M | 3.30M | -12.40M | 2.32M | 10.43M | 15.67M | 16.14M | 18.11M | 20.14M | 29.45M | 21.52M | 17.39M | 11.70M | 6.06M | 4.76M |
| Income Before Tax Ratio | -11.09% | -4.84% | 4.01% | -6.59% | 2.80% | -14.29% | 1.98% | 7.74% | 11.58% | 11.78% | 14.40% | 13.33% | 19.53% | 17.35% | 17.02% | 17.94% | 15.27% | 15.57% |
| Income Tax Expense | 346.95K | 11.71M | 5.55M | -1.10M | 1.08M | -1.85M | 662.83K | 3.11M | 4.12M | 4.43M | 5.09M | 5.46M | 7.80M | 5.96M | 4.67M | 2.92M | 2.00M | 1.57M |
| Net Income | -9.95M | -16.57M | 905.54K | -5.55M | 2.22M | -10.55M | 1.66M | 7.31M | 11.54M | 11.71M | 13.01M | 14.67M | 21.65M | 15.55M | 12.72M | 8.77M | 4.06M | 3.19M |
| Net Income Ratio | -11.49% | -16.51% | 0.56% | -5.50% | 1.89% | -12.16% | 1.42% | 5.43% | 8.53% | 8.54% | 10.35% | 9.71% | 14.36% | 12.54% | 12.45% | 13.46% | 10.23% | 10.45% |
| EPS | -0.99 | -1.66 | 0.15 | -2.10 | 1.01 | -4.90 | 0.80 | 3.40 | 5.70 | 6.10 | 7.10 | 7.90 | 11.80 | 8.90 | 10.40 | 7.70 | 4.00 | 4.23 |
| EPS Diluted | -0.99 | -1.66 | 0.15 | -2.10 | 1.01 | -4.88 | 0.80 | 3.40 | 5.70 | 6.10 | 7.10 | 7.90 | 11.80 | 8.90 | 10.40 | 7.70 | 4.00 | 4.23 |
| Weighted Avg Shares Out | 10.07M | 9.97M | 5.98M | 2.65M | 2.20M | 2.15M | 2.15M | 2.14M | 2.03M | 1.93M | 1.85M | 1.85M | 1.83M | 1.74M | 1.22M | 1.08M | 1.00M | 754.53K |
| Weighted Avg Shares Out (Dil) | 10.07M | 9.97M | 5.98M | 2.65M | 2.20M | 2.16M | 2.15M | 2.14M | 2.03M | 1.93M | 1.85M | 1.85M | 1.83M | 1.74M | 1.22M | 1.08M | 1.00M | 754.53K |

Design News: Orient Express pop-up, Okamura's first S'pore store, and more

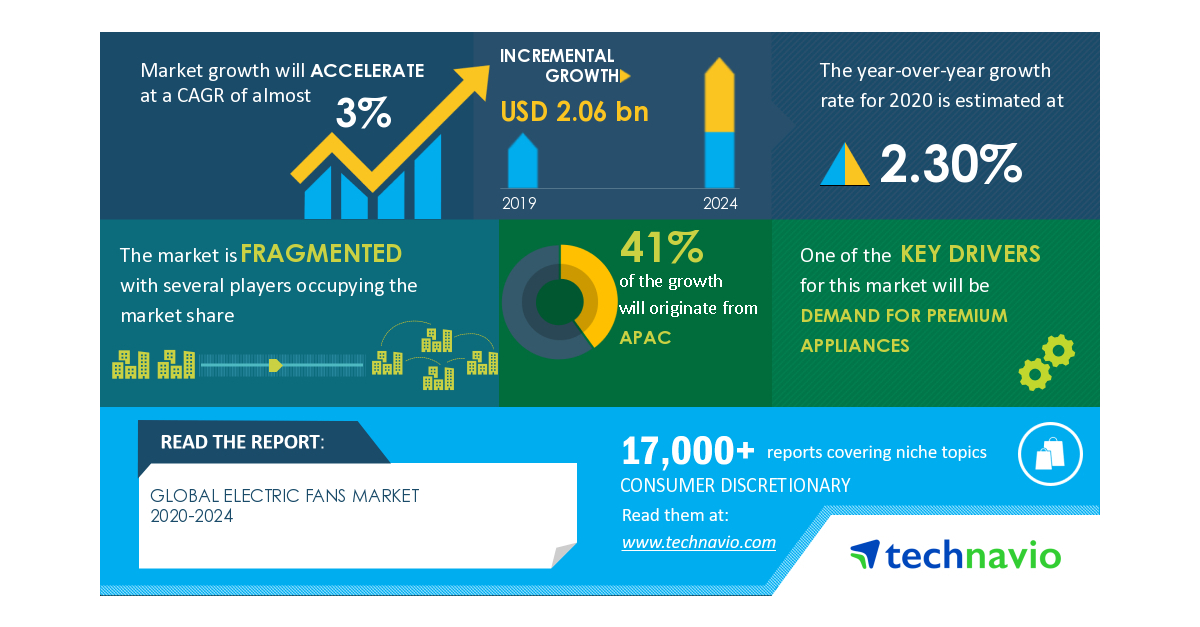
Electric Fans Market will Showcase Negative Impact during 2020-2024 | Demand For Premium Appliances to Boost the Market Growth | Technavio

Utility crews work through the night to restore power to thousands of Mainers

Weather delays CMP’s solution to lights on Chops Point towers

Wide-Moat Stocks On Sale - The October 2020 Heat Map

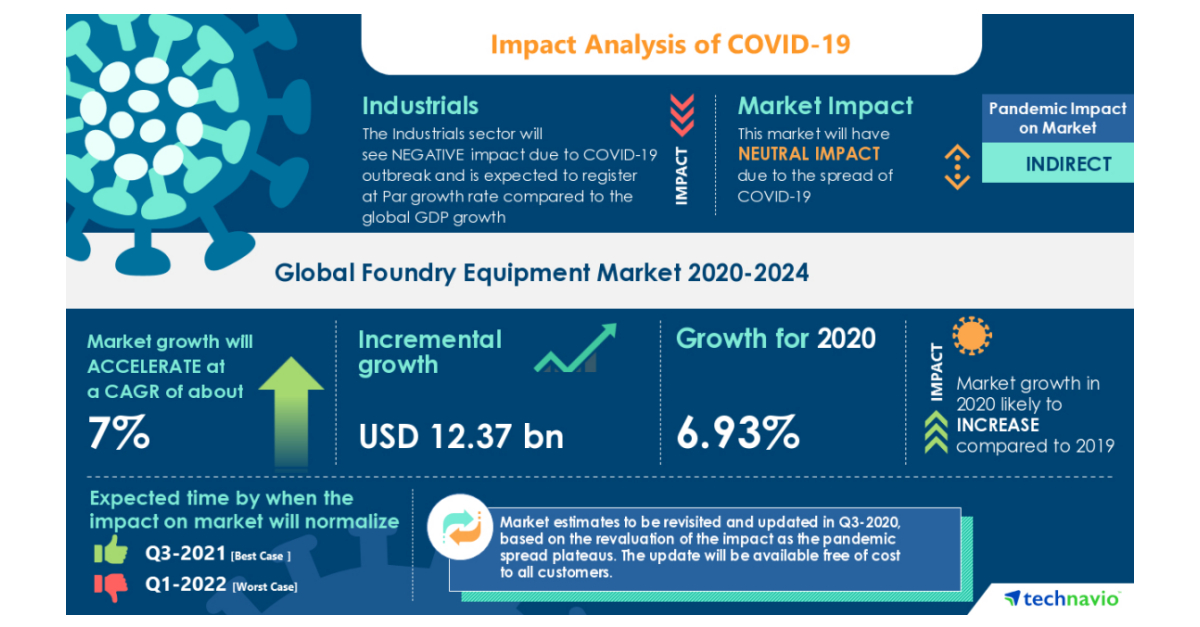
Foundry Equipment Market- Roadmap for Recovery From COVID-19 | Increase in Production of Light Vehicles to Boost the Market Growth | Technavio

Los cinco mejores libros de Agatha Christie y por qué hay que leerlos

Los cinco mejores libros de Agatha Christie y por qué hay que leerlos

Death On The Nile Repeated Orient Express' Weird Marketing Choice
Source: https://incomestatements.info
Category: Stock Reports

