See more : Wheels Up Experience Inc. (UP-WT) Income Statement Analysis – Financial Results
Complete financial analysis of SEALSQ Corp (LAES) income statement, including revenue, profit margins, EPS and key performance metrics. Get detailed insights into the financial performance of SEALSQ Corp, a leading company in the Semiconductors industry within the Technology sector.
- Nidec Chaun-Choung Technology Corporation (6230.TW) Income Statement Analysis – Financial Results
- ElringKlinger AG (EGKLF) Income Statement Analysis – Financial Results
- 1st Colonial Bancorp, Inc. (FCOB) Income Statement Analysis – Financial Results
- gooddays holdings, Inc. (4437.T) Income Statement Analysis – Financial Results
- Warrior Gold Inc. (WAR.V) Income Statement Analysis – Financial Results
SEALSQ Corp (LAES)
About SEALSQ Corp
SEALSQ Corp develops and sells semiconductor chips for private and public sectors. The company offers semiconductors and smart card reader chips; identity provisioning services; and managed PKI for IoT solutions. It serves consumer electronics, aerospace and military, satellite and telecommunications, smart energy and smart building, smart industries, logistics, medical, and consumer industries. SEALSQ Corp was incorporated in 2022 and is based in Cointrin, Switzerland. SEALSQ Corp is a subsidiary of WISeKey International Holding AG.
| Metric | 2023 | 2022 | 2021 | 2020 |
|---|---|---|---|---|
| Revenue | 30.06M | 23.20M | 17.00M | 14.32M |
| Cost of Revenue | 16.01M | 13.40M | 9.85M | 8.88M |
| Gross Profit | 14.05M | 9.80M | 7.15M | 5.43M |
| Gross Profit Ratio | 46.74% | 42.24% | 42.05% | 37.95% |
| Research & Development | 3.95M | 2.31M | 3.05M | 4.13M |
| General & Administrative | 8.64M | 3.09M | 7.64M | 9.46M |
| Selling & Marketing | 5.65M | 3.82M | 4.25M | 3.10M |
| SG&A | 14.29M | 6.92M | 11.89M | 12.56M |
| Other Expenses | -48.00K | -4.00K | -94.00K | 1.00K |
| Operating Expenses | 18.19M | 7.22M | 14.85M | 16.69M |
| Cost & Expenses | 34.20M | 20.62M | 24.70M | 25.57M |
| Interest Income | 88.00K | 9.00K | 0.00 | 8.00K |
| Interest Expense | 987.00K | 605.00K | 168.00K | 9.00K |
| Depreciation & Amortization | 570.00K | 427.20K | 1.68M | 3.03M |
| EBITDA | -1.49M | 3.71M | -3.41M | -6.75M |
| EBITDA Ratio | -4.94% | 12.91% | -36.82% | -58.66% |
| Operating Income | -4.14M | 2.58M | -7.70M | -11.26M |
| Operating Income Ratio | -13.78% | 11.13% | -45.31% | -78.61% |
| Total Other Income/Expenses | 1.10M | -58.00K | -232.08K | -1.21M |
| Income Before Tax | -3.04M | 2.53M | -7.48M | -11.87M |
| Income Before Tax Ratio | -10.12% | 10.88% | -44.02% | -82.88% |
| Income Tax Expense | 225.00K | -3.25M | 6.00K | 5.00K |
| Net Income | -3.27M | 5.77M | -7.49M | -11.87M |
| Net Income Ratio | -10.87% | 24.87% | -44.05% | -82.92% |
| EPS | -0.24 | 0.38 | -0.49 | -0.78 |
| EPS Diluted | -0.24 | 0.38 | -0.49 | -0.78 |
| Weighted Avg Shares Out | 15.30M | 15.13M | 15.13M | 15.13M |
| Weighted Avg Shares Out (Dil) | 15.30M | 15.13M | 15.13M | 15.13M |
SEALSQ to Unveil Next-Gen Semiconductor Innovation

SEALSQ Corp Announces 2023 Fiscal Year Results
SEALSQ to Unveil Next-Gen Semiconductor Innovation Initiatives and U.S. Expansion Plans During its First Analyst & Investor Day Scheduled for April 1, 2024, at the Nasdaq Market Site

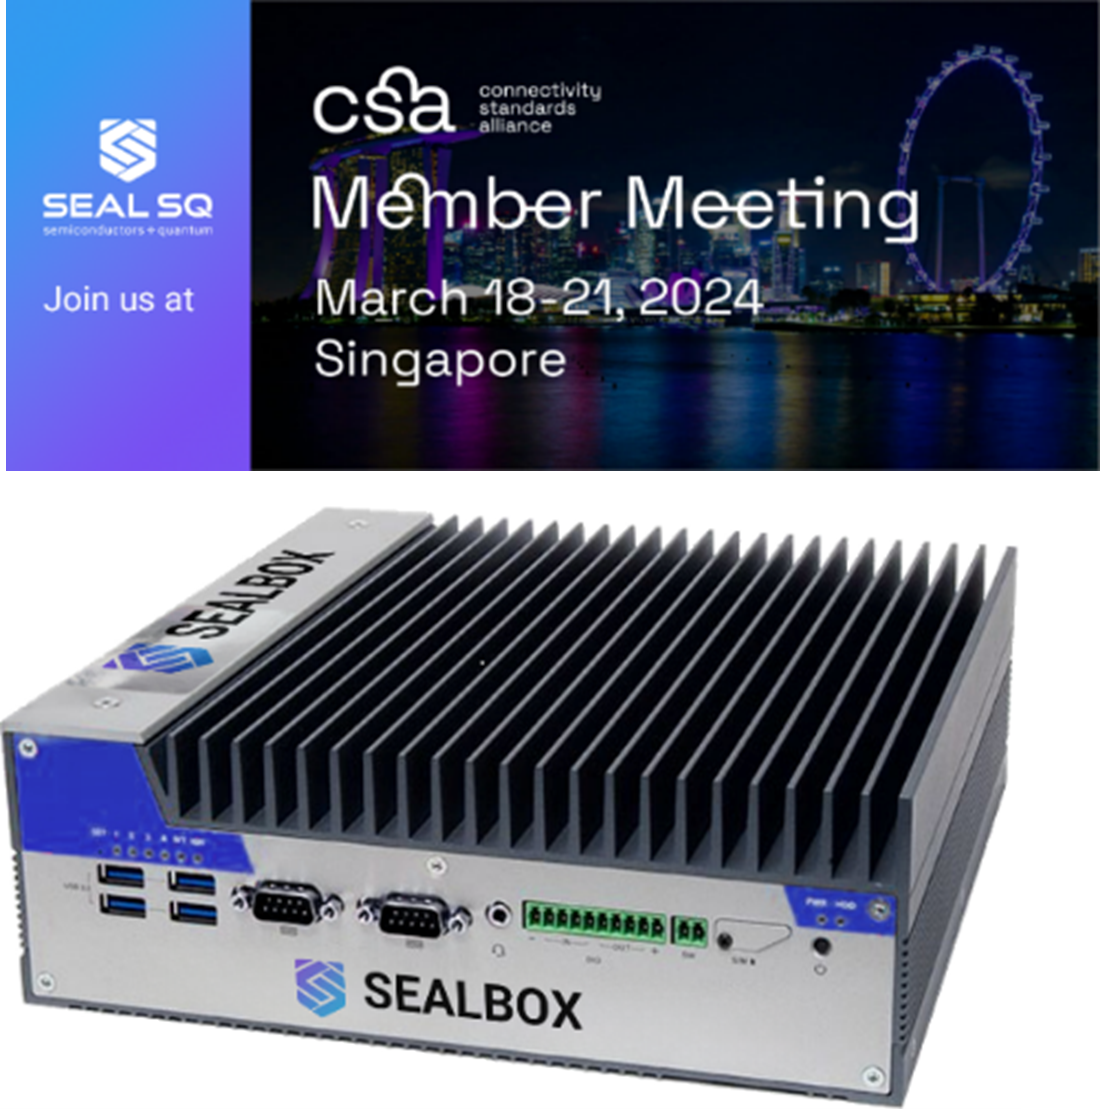
SEALSQ Corp Showcases Its All-In-One Solution for Consumer IoT Device Makers to Achieve New Product Security Verified Mark™ During the Connectivity Standards Alliance (CSA) Event in Singapore

SEALSQ Launches SEALBOX TM

SEALSQ Launches SEALBOX TM

SEALSQ Introduces SEALDATA Service

SEALSQ Unveils New Upgrades to INeS, Its Certificate Management Solution (CMS), Tailored for the Internet of Things (IoT) Domain

7 Under-$10 Stocks That Will Be Worth $100 (or More!) by 2026

SEALSQ eUICC SIMs: Advancing Cellular Connectivity in IoT Devices
Source: https://incomestatements.info
Category: Stock Reports
