See more : Research Alliance Corp. II (RACB) Income Statement Analysis – Financial Results
Complete financial analysis of Lagardere SA (LGDDF) income statement, including revenue, profit margins, EPS and key performance metrics. Get detailed insights into the financial performance of Lagardere SA, a leading company in the Travel Services industry within the Consumer Cyclical sector.
- Svenska Handelsbanken AB (publ) (SHB-B.ST) Income Statement Analysis – Financial Results
- Amalgamated Financial Corp. (AMAL) Income Statement Analysis – Financial Results
- Fission Uranium Corp. (FCUUF) Income Statement Analysis – Financial Results
- Japan Communications Inc. (9424.T) Income Statement Analysis – Financial Results
- Great Western Mining Corporation PLC (8GW.IR) Income Statement Analysis – Financial Results
Lagardere SA (LGDDF)
About Lagardere SA
Lagardere SA engages in content publishing, production, broadcasting, and distribution businesses worldwide. It operates through two divisions: Lagardère Publishing, and Lagardère Travel Retail. The Lagardère Publishing division includes book publishing and e-publishing businesses, which cover the areas of education, general literature, illustrated books, partworks, dictionaries, youth works, mobile games, board games, and distribution in English, French, and Spanish languages. The Lagardère Travel Retail division is involved in retail activities in transit hubs and concessions in travel essentials, duty free and fashion, and food services fields. As of December 31, 2021, this segment operated 2,928 stores under its own international store names, such as Relay, Hubiz, 1Minute, Hub Convenience, Discover, Tech2go, Aelia Duty Free, The Fashion Gallery, The Fashion Place, Eye Love, So Chocolate, Bread&Co., Hello!, So! Coffee, Trib's, Vino Volo, Natoo, etc., as well as store names with a local identity comprising BuY Paris Duty Free, Casa Del Gusto, and The Belgian Chocolate House. It also operates stores under franchises or licenses, with retail partners that include TripAdvisor, Fnac, iStore, Marks & Spencer, Hermès, Victoria's Secret, Nespresso, Costa Coffee, Burger King, Dean & Deluca, Eric Kayser, and Paul. The company was formerly known as Lagardère SCA and changed its name to Lagardere SA in June 2021. The company was founded in 1826 and is headquartered in Paris, France.
| Metric | 2023 | 2022 | 2021 | 2020 | 2019 | 2018 | 2017 | 2016 | 2015 | 2014 | 2013 | 2012 | 2011 | 2010 | 2009 | 2008 | 2007 | 2006 | 2005 | 2004 |
|---|---|---|---|---|---|---|---|---|---|---|---|---|---|---|---|---|---|---|---|---|
| Revenue | 8.13B | 6.98B | 5.17B | 4.48B | 7.30B | 6.95B | 7.18B | 7.66B | 7.46B | 7.49B | 7.56B | 7.37B | 8.05B | 8.34B | 7.89B | 8.21B | 8.58B | 7.91B | 13.01B | 12.30B |
| Cost of Revenue | 4.74B | 6.64B | 5.20B | 4.87B | 6.95B | 4.09B | 3.78B | 4.22B | 4.23B | 4.47B | 4.63B | 3.48B | 3.61B | 3.55B | 3.65B | 0.00 | 3.89B | 3.58B | 6.86B | 6.62B |
| Gross Profit | 3.39B | 336.00M | -27.00M | -386.00M | 350.00M | 2.86B | 3.40B | 3.44B | 3.22B | 3.03B | 2.93B | 3.89B | 4.44B | 4.79B | 4.24B | 8.21B | 4.69B | 4.34B | 6.16B | 5.68B |
| Gross Profit Ratio | 41.70% | 4.82% | -0.52% | -8.62% | 4.80% | 41.19% | 47.33% | 44.93% | 43.24% | 40.38% | 38.78% | 52.75% | 55.21% | 57.43% | 53.71% | 100.00% | 54.64% | 54.80% | 47.32% | 46.19% |
| Research & Development | 0.00 | 0.00 | 0.00 | 0.00 | 0.00 | 0.00 | 0.00 | 0.00 | 0.00 | 0.00 | 0.00 | 0.00 | 0.00 | 0.00 | 0.00 | 0.00 | 0.00 | 0.00 | 0.00 | 0.00 |
| General & Administrative | 0.00 | 0.00 | 1.58B | 1.47B | 1.85B | 2.58B | 2.50B | 2.53B | 2.35B | 2.23B | 2.12B | 2.13B | 2.20B | 2.40B | 0.00 | 0.00 | 0.00 | 0.00 | 0.00 | 0.00 |
| Selling & Marketing | 0.00 | 0.00 | -1.56B | -1.40B | -1.82B | -715.00M | 25.00M | 0.00 | 0.00 | 0.00 | 0.00 | 0.00 | 0.00 | 2.40B | 2.29B | 0.00 | 0.00 | 0.00 | 0.00 | 0.00 |
| SG&A | 2.23B | 41.00M | 20.00M | 76.00M | 30.00M | 1.87B | 2.53B | 2.53B | 2.35B | 2.23B | 2.12B | 2.13B | 2.20B | 2.40B | 2.29B | 0.00 | 0.00 | 0.00 | 0.00 | 0.00 |
| Other Expenses | 0.00 | 38.00M | 44.00M | 21.00M | 64.00M | 75.00M | 37.00M | -36.00M | 18.00M | 0.00 | 0.00 | 1.43B | 1.92B | 1.96B | -121.00M | -7.39B | -46.00M | 16.00M | 94.00M | 54.00M |
| Operating Expenses | 2.23B | 3.00M | -24.00M | 55.00M | -34.00M | 2.42B | 3.13B | 3.11B | 3.05B | 2.82B | 1.41B | 3.56B | 4.13B | 4.36B | -121.00M | -7.39B | 4.15B | 3.85B | 5.26B | 4.69B |
| Cost & Expenses | 6.97B | 6.64B | 5.17B | 4.92B | 6.91B | 6.51B | 6.91B | 7.33B | 7.29B | 7.29B | 6.04B | 7.04B | 7.73B | 7.91B | -121.00M | -7.39B | 8.05B | 7.43B | 12.12B | 11.31B |
| Interest Income | 7.00M | 8.00M | 7.00M | 6.00M | 7.00M | 124.00M | 65.00M | 66.00M | 62.00M | 67.00M | 90.00M | 7.00M | 12.00M | 18.00M | 5.00M | 7.00M | 36.00M | 23.00M | 72.00M | 52.00M |
| Interest Expense | 200.00M | 142.00M | 139.00M | 139.00M | 143.00M | 133.00M | 83.00M | 76.00M | 68.00M | 73.00M | 95.00M | 93.00M | 112.00M | 100.00M | 87.00M | 183.00M | 211.00M | 169.00M | 171.00M | 176.00M |
| Depreciation & Amortization | 663.00M | 612.00M | 672.00M | 769.00M | 814.00M | 691.00M | 260.00M | 306.00M | 263.00M | 223.00M | 214.00M | 246.00M | 305.00M | 238.00M | 7.43B | 7.46B | 203.00M | 128.00M | 334.00M | 343.00M |
| EBITDA | 1.10B | 926.00M | 744.00M | 267.00M | 1.22B | 503.00M | 590.00M | 618.00M | 555.00M | 522.00M | 514.00M | 424.00M | 31.00M | 668.00M | 631.00M | 8.21B | 1.08B | 708.00M | 1.35B | 1.31B |
| EBITDA Ratio | 13.52% | 13.54% | 12.94% | 7.32% | 16.42% | 7.24% | 8.22% | 8.07% | 7.44% | 6.97% | 6.80% | 7.72% | 15.35% | 9.81% | 100.00% | 100.83% | 8.94% | 9.67% | 10.47% | 10.96% |
| Operating Income | 1.16B | 333.00M | -3.00M | -441.00M | 384.00M | 285.00M | 330.00M | 312.00M | 292.00M | 299.00M | 300.00M | 323.00M | 930.00M | 343.00M | 461.00M | 825.00M | 867.00M | 585.00M | 920.00M | 889.00M |
| Operating Income Ratio | 14.24% | 4.77% | -0.06% | -9.84% | 5.26% | 4.10% | 4.60% | 4.07% | 3.92% | 3.99% | 3.97% | 4.38% | 11.56% | 4.11% | 5.84% | 10.04% | 10.10% | 7.40% | 7.07% | 7.23% |
| Total Other Income/Expenses | -910.00M | -201.00M | -91.00M | -354.00M | -111.00M | -676.00M | -166.00M | -28.00M | -218.00M | -193.00M | 627.00M | -181.00M | -747.00M | -82.00M | -174.00M | -176.00M | -204.00M | -174.00M | -76.00M | -97.00M |
| Income Before Tax | 248.00M | 172.00M | -67.00M | -641.00M | 267.00M | 318.00M | 202.00M | 265.00M | 108.00M | 136.00M | 1.44B | 146.00M | -584.00M | 261.00M | 287.00M | 649.00M | 663.00M | 411.00M | 844.00M | 792.00M |
| Income Before Tax Ratio | 3.05% | 2.47% | -1.30% | -14.31% | 3.66% | 4.57% | 2.81% | 3.46% | 1.45% | 1.82% | 18.98% | 1.98% | -7.26% | 3.13% | 3.64% | 7.90% | 7.73% | 5.20% | 6.49% | 6.44% |
| Income Tax Expense | 78.00M | 33.00M | 22.00M | -31.00M | 55.00M | 124.00M | 2.00M | 69.00M | 37.00M | 87.00M | 117.00M | 40.00M | 105.00M | 67.00M | 123.00M | 22.00M | 99.00M | 92.00M | 142.00M | 240.00M |
| Net Income | 144.00M | 161.00M | -101.00M | -660.00M | -15.00M | 177.00M | 176.00M | 175.00M | 74.00M | 41.00M | 1.31B | 89.00M | -707.00M | 163.00M | 137.00M | 593.00M | 534.00M | 291.00M | 670.00M | 495.00M |
| Net Income Ratio | 1.77% | 2.31% | -1.95% | -14.73% | -0.21% | 2.55% | 2.45% | 2.29% | 0.99% | 0.55% | 17.28% | 1.21% | -8.78% | 1.95% | 1.74% | 7.22% | 6.22% | 3.68% | 5.15% | 4.03% |
| EPS | 0.97 | 1.15 | -0.75 | -5.11 | -0.12 | 1.36 | 1.36 | 1.36 | 0.58 | 0.32 | 10.22 | 0.70 | -5.56 | 1.29 | 1.08 | 1.08 | 4.62 | 2.13 | 4.88 | 3.65 |
| EPS Diluted | 1.01 | 1.14 | -0.75 | -5.11 | -0.12 | 1.35 | 1.34 | 1.34 | 0.57 | 0.32 | 10.09 | 0.69 | -5.56 | 1.27 | 1.07 | 1.07 | 4.62 | 2.09 | 4.74 | 3.44 |
| Weighted Avg Shares Out | 148.45M | 140.33M | 134.76M | 129.20M | 129.36M | 129.72M | 129.37M | 128.99M | 128.48M | 128.05M | 127.90M | 127.61M | 127.20M | 126.96M | 126.92M | 131.13M | 115.58M | 136.94M | 137.35M | 144.25M |
| Weighted Avg Shares Out (Dil) | 142.56M | 141.24M | 134.76M | 129.20M | 129.36M | 131.53M | 131.53M | 130.79M | 129.79M | 129.59M | 129.59M | 129.22M | 127.20M | 128.17M | 127.50M | 131.13M | 115.58M | 139.30M | 141.59M | 144.25M |
Lagardere says it closes in on sale of Paris Match magazine to LVMH
Arnaud Lagardere to resign from executive roles due to court indictment

Lagardere SA (LGDDF) Q4 2023 Earnings Call Transcript
Lagardere will remain listed, Vivendi chairman tells Figaro
Lagardere Builds Out Marseille Stronghold And Tests Checkout-Free Model In Hong Kong
Lagardere revenue rises on strong growth
Travel Retail Firmly Back In The Driving Seat At French Media Group Lagardere As Sales Top €5 Billion

A Master Concession In Saudi Arabia Is A Timely Win For French Travel Retailer Lagardere
Duty-Free Sales: Dufry Versus Lagardere Travel Retail
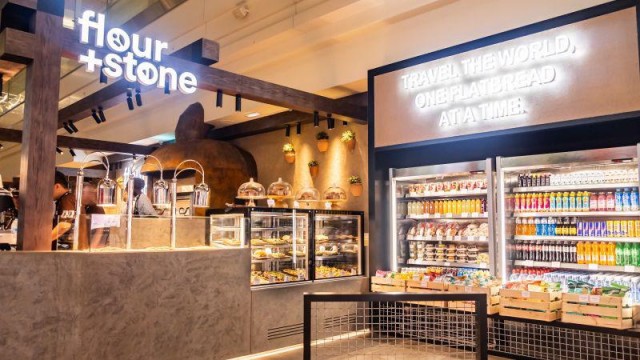
Lagardere Extends F&B Foothold In Middle East As Global Sales Rebound By 33%
Source: https://incomestatements.info
Category: Stock Reports
