See more : Beijing Yanjing Brewery Co.,Ltd. (000729.SZ) Income Statement Analysis – Financial Results
Complete financial analysis of L’Oréal S.A. (LRLCY) income statement, including revenue, profit margins, EPS and key performance metrics. Get detailed insights into the financial performance of L’Oréal S.A., a leading company in the Household & Personal Products industry within the Consumer Defensive sector.
- Optima Technology Group Limited (OPA.AX) Income Statement Analysis – Financial Results
- Sociedad de Inversiones Oro Blanco S.A. (ORO-BLANCO.SN) Income Statement Analysis – Financial Results
- BYD Electronic (International) Company Limited (0285.HK) Income Statement Analysis – Financial Results
- AdUX SA (ADUX.PA) Income Statement Analysis – Financial Results
- Nusasiri Public Company Limited (NUSA.BK) Income Statement Analysis – Financial Results
L'Oréal S.A. (LRLCY)
About L'Oréal S.A.
L'Oréal S.A., through its subsidiaries, manufactures and sells cosmetic products for women and men worldwide. The company operates through four divisions: Consumer Products, L'oréal Luxe, Professional Products, and Active Cosmetics. It offers shampoos, hair care products, shower gels, skin care products, cleansers, hair colors, styling products, deodorants, sun care products, make-up, perfumes, etc. The company provides its products under the L'Oréal Paris, Garnier, Maybelline New York, NYX Professional Makeup, Essie, Niely, Dark and Lovely, Lancôme, Yves Saint Laurent Beauté, Giorgio Armani Beauty, Kiehl's, Urban Decay, Biotherm, Ralph Lauren, IT Cosmetics, L'Oréal Professionnel, Kérastase, Redken, Matrix, Biolage, Pureology, Decléor, Carita, Vichy, La Roche-Posay, SkinCeuticals, Roger&Gallet, CeraVe, Stylenanda, Mixa, Magic Mask, Prada, Helena Rubinstein, Valentino, Mugler, Shu Uemura, Viktor&Rolf, Azzaro, Diesel, Atelier Cologne, Cacharel, and Yue Sai brands. It sells its products through distribution channels, such as hair salons, mass-market retail channels, perfumeries, department stores, pharmacies, drugstores, medispas, branded retail, travel retail, and e-commerce. L'Oréal S.A. was founded in 1909 and is headquartered in Clichy, France.
| Metric | 2023 | 2022 | 2021 | 2020 | 2019 | 2018 | 2017 | 2016 | 2015 | 2014 | 2013 | 2012 | 2011 | 2010 | 2009 | 2008 | 2007 | 2006 | 2005 | 2004 | 2003 | 2002 | 2001 | 2000 | 1999 | 1998 |
|---|---|---|---|---|---|---|---|---|---|---|---|---|---|---|---|---|---|---|---|---|---|---|---|---|---|---|
| Revenue | 41.18B | 38.26B | 32.29B | 27.99B | 29.87B | 26.94B | 31.22B | 26.22B | 26.38B | 27.27B | 30.47B | 28.53B | 20.34B | 19.50B | 17.47B | 17.54B | 17.06B | 15.79B | 14.53B | 13.64B | 14.03B | 14.29B | 13.74B | 12.67B | 10.75B | 9.59B |
| Cost of Revenue | 10.77B | 10.58B | 8.43B | 7.53B | 8.06B | 7.33B | 8.83B | 7.44B | 7.60B | 7.87B | 8.79B | 8.42B | 5.85B | 5.70B | 5.16B | 5.19B | 4.94B | 4.57B | 4.35B | 4.10B | 2.52B | 2.52B | 11.64B | 10.72B | 9.19B | 8.24B |
| Gross Profit | 30.42B | 27.68B | 23.85B | 20.46B | 21.81B | 19.61B | 22.39B | 18.79B | 18.78B | 19.40B | 21.68B | 20.11B | 14.49B | 13.80B | 12.31B | 12.35B | 12.12B | 11.22B | 10.19B | 9.54B | 11.51B | 11.77B | 2.10B | 1.95B | 1.56B | 1.34B |
| Gross Profit Ratio | 73.86% | 72.35% | 73.88% | 73.09% | 73.00% | 72.78% | 71.72% | 71.63% | 71.21% | 71.15% | 71.17% | 70.48% | 71.24% | 70.78% | 70.46% | 70.43% | 71.04% | 71.06% | 70.09% | 69.94% | 82.04% | 82.37% | 15.27% | 15.39% | 14.56% | 14.01% |
| Research & Development | 1.29B | 1.14B | 1.03B | 964.40M | 985.30M | 914.40M | 1.05B | 885.38M | 855.17M | 920.66M | 1.03B | 897.09M | 720.50M | 664.70M | 609.20M | 587.50M | 559.90M | 532.50M | 496.20M | 466.60M | 0.00 | 0.00 | 0.00 | 0.00 | 0.00 | 0.00 |
| General & Administrative | 7.63B | 7.03B | 6.07B | 5.64B | 6.07B | 5.62B | 6.55B | 5.53B | 5.51B | 5.87B | 6.41B | 5.91B | 4.19B | 4.05B | 3.74B | 3.77B | 3.62B | 3.31B | 3.01B | 2.84B | 2.70B | 2.76B | 0.00 | 0.00 | 0.00 | 0.00 |
| Selling & Marketing | 13.36B | 19.09B | 16.67B | 14.29B | 9.21B | 8.14B | 9.18B | 7.65B | 7.75B | 7.94B | 9.12B | 8.61B | 6.29B | 6.03B | 5.39B | 5.27B | 5.13B | 4.78B | 4.37B | 4.18B | 6.36B | 6.52B | 0.00 | 0.00 | 0.00 | 0.00 |
| SG&A | 20.98B | 19.09B | 16.67B | 14.29B | 15.28B | 13.77B | 15.73B | 13.18B | 13.26B | 13.81B | 15.53B | 14.52B | 10.48B | 10.08B | 9.12B | 9.04B | 8.74B | 8.09B | 7.38B | 7.02B | 9.07B | 9.28B | 0.00 | 0.00 | 0.00 | 0.00 |
| Other Expenses | 0.00 | -22.50M | -20.00M | -119.50M | -125.60M | 5.00M | -4.90M | -11.00M | -105.00M | 331.10M | 327.50M | 0.00 | 0.00 | 274.80M | 247.10M | 88.40M | 871.90M | 156.60M | 9.30M | -126.20M | 0.00 | -79.90M | -124.30M | -218.80M | 0.00 | -88.60M |
| Operating Expenses | 22.27B | 20.23B | 17.69B | 15.32B | 16.26B | 14.68B | -17.15B | -14.64B | -14.33B | -15.13B | -16.75B | -15.59B | 11.20B | 10.74B | 10.01B | 9.63B | 9.30B | 8.62B | 7.87B | 7.49B | 9.55B | 9.93B | 472.50M | 409.50M | 299.00M | 276.10M |
| Cost & Expenses | 33.04B | 30.80B | 26.13B | 22.85B | 24.33B | 22.02B | -8.32B | -7.20B | -6.73B | -7.26B | -7.96B | -7.17B | 17.05B | 16.44B | 15.17B | 14.82B | 14.25B | 13.19B | 12.22B | 11.59B | 12.07B | 12.45B | 12.11B | 11.13B | 9.48B | 8.52B |
| Interest Income | 113.30M | 69.80M | 18.50M | 19.80M | 28.70M | 47.90M | 423.52M | 376.91M | 408.36M | 413.85M | 469.32M | 423.36M | 28.50M | 17.20M | 16.00M | 34.60M | -7.60M | -3.60M | -3.30M | -3.90M | 0.00 | 0.00 | 0.00 | 0.00 | 0.00 | 0.00 |
| Interest Expense | 226.70M | 76.90M | 48.10M | 92.50M | 87.70M | 42.70M | 51.80M | 47.70M | 52.40M | 60.50M | 61.40M | 27.30M | 48.10M | 43.80M | 92.00M | 208.80M | 174.50M | 115.90M | 63.80M | 43.10M | 93.90M | 142.20M | 0.00 | 159.30M | 0.00 | 101.50M |
| Depreciation & Amortization | 1.72B | 1.47B | 1.46B | 1.62B | 1.60B | 1.10B | 1.15B | 985.30M | 1.00B | 935.67M | 1.02B | 910.80M | 614.30M | 734.20M | 834.00M | 706.10M | 598.50M | 579.40M | 426.90M | 413.20M | 615.20M | 721.20M | 472.50M | 409.50M | 299.00M | 276.10M |
| EBITDA | 9.94B | 9.22B | 7.88B | 6.90B | 7.46B | 6.34B | 5.82B | 5.47B | 5.44B | 4.81B | 4.76B | 4.40B | 4.13B | 3.93B | 3.40B | 3.55B | 4.29B | 3.27B | 2.87B | 2.52B | 2.58B | 2.56B | 2.10B | 1.95B | 1.56B | 1.34B |
| EBITDA Ratio | 24.15% | 24.68% | 25.67% | 26.41% | 26.00% | 23.89% | 22.38% | 21.96% | 21.50% | 20.57% | 20.17% | 19.64% | 20.77% | 20.94% | 19.44% | 20.22% | 25.14% | 20.72% | 19.75% | 18.45% | 18.38% | 17.93% | 15.27% | 15.39% | 14.56% | 14.01% |
| Operating Income | 8.14B | 7.46B | 6.16B | 5.21B | 5.55B | 4.92B | 5.61B | 4.72B | 4.67B | 4.67B | 5.13B | 4.69B | 3.29B | 3.06B | 2.30B | 2.72B | 2.83B | 2.54B | 2.28B | 1.96B | 1.66B | 1.78B | 1.63B | 1.54B | 1.27B | 1.07B |
| Operating Income Ratio | 19.77% | 19.49% | 19.08% | 18.61% | 18.57% | 18.27% | 17.97% | 18.00% | 17.71% | 17.14% | 16.82% | 16.44% | 16.19% | 15.68% | 13.16% | 15.53% | 16.57% | 16.09% | 15.66% | 14.39% | 11.84% | 12.45% | 11.83% | 12.16% | 11.78% | 11.13% |
| Total Other Income/Expenses | -142.30M | 155.10M | -113.40M | -432.50M | -136.10M | 261.80M | 326.90M | -209.00M | 144.30M | -13.80M | 164.60M | 193.90M | 174.10M | 95.00M | 171.10M | -93.00M | 690.00M | 35.90M | 103.80M | 97.70M | 208.90M | -79.90M | -124.30M | -218.80M | -140.60M | -88.60M |
| Income Before Tax | 8.00B | 7.61B | 6.05B | 4.78B | 5.41B | 5.18B | 5.67B | 4.52B | 4.87B | 4.69B | 5.41B | 4.94B | 3.47B | 3.15B | 2.47B | 2.63B | 3.52B | 2.58B | 2.38B | 2.06B | 1.87B | 1.70B | 1.50B | 1.32B | 1.13B | 978.90M |
| Income Before Tax Ratio | 19.43% | 19.89% | 18.73% | 17.06% | 18.11% | 19.24% | 18.16% | 17.25% | 18.45% | 17.21% | 17.74% | 17.32% | 17.04% | 16.17% | 14.14% | 15.00% | 20.61% | 16.32% | 16.37% | 15.10% | 13.33% | 11.89% | 10.93% | 10.43% | 10.47% | 10.21% |
| Income Tax Expense | 1.81B | 1.90B | 1.45B | 1.21B | 1.66B | 1.28B | 1.08B | 1.28B | 1.34B | 1.34B | 1.44B | 1.30B | 1.03B | 909.90M | 676.10M | 680.70M | 859.70M | 514.70M | 405.90M | 618.60M | 628.70M | 579.80M | 535.90M | 488.50M | 428.70M | 375.00M |
| Net Income | 6.18B | 5.71B | 4.60B | 3.56B | 3.75B | 3.90B | 3.58B | 3.11B | 3.30B | 3.35B | 3.96B | 2.87B | 2.44B | 2.24B | 1.79B | 1.95B | 2.66B | 2.06B | 1.97B | 1.44B | 1.49B | 1.28B | 1.29B | 969.40M | 787.20M | 680.00M |
| Net Income Ratio | 15.02% | 14.92% | 14.24% | 12.73% | 12.55% | 14.46% | 11.47% | 11.84% | 12.50% | 12.28% | 13.01% | 10.05% | 11.99% | 11.49% | 10.26% | 11.11% | 15.57% | 13.05% | 13.57% | 10.55% | 10.63% | 8.94% | 9.39% | 7.65% | 7.32% | 7.09% |
| EPS | 11.52 | 10.65 | 8.24 | 6.37 | 6.70 | 1.39 | 8.13 | 5.75 | 6.24 | 1.15 | 1.30 | 6.01 | 0.82 | 0.76 | 0.61 | 0.66 | 0.88 | 0.67 | 0.63 | 0.44 | 0.49 | 0.43 | 0.36 | 0.29 | 0.24 | 0.21 |
| EPS Diluted | 11.52 | 10.61 | 8.21 | 6.34 | 6.66 | 1.38 | 8.14 | 5.74 | 6.25 | 1.14 | 1.30 | 6.01 | 0.82 | 0.76 | 0.61 | 0.66 | 0.88 | 0.67 | 0.63 | 0.44 | 0.49 | 0.43 | 0.36 | 0.29 | 0.24 | 0.21 |
| Weighted Avg Shares Out | 536.81M | 2.68B | 2.79B | 2.80B | 2.80B | 2.80B | 2.82B | 2.82B | 2.82B | 2.93B | 3.04B | 3.03B | 2.96B | 2.93B | 2.92B | 2.94B | 3.00B | 3.07B | 3.15B | 3.15B | 3.38B | 3.38B | 3.38B | 3.38B | 3.38B | 3.38B |
| Weighted Avg Shares Out (Dil) | 537.02M | 2.69B | 2.80B | 2.81B | 2.81B | 2.82B | 2.82B | 2.82B | 2.83B | 2.93B | 3.04B | 3.03B | 2.99B | 2.96B | 2.92B | 2.95B | 3.03B | 3.08B | 3.15B | 3.25B | 3.38B | 3.38B | 3.38B | 3.38B | 3.38B | 3.38B |

L'Oreal: An Incredibly High Quality Expensive Business

3 Stocks to Buy for a Billionaire-Backed Portfolio

L'Oreal SA (LRLCY) Upgraded to Buy: What Does It Mean for the Stock?

L'Oréal's Latest Acquisition Could Be a Game Changer

Buy These "Beauty" Stocks for More Gains?

Is There More Room For Growth In L'Oreal Stock?

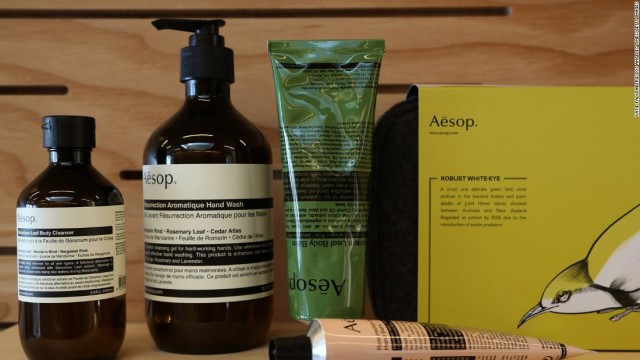
Natura & Co stock falls on investor concerns regarding Aesop sale to L'Oreal

L'Oreal Sets Eyes on Chinese Consumers, Buys Luxury Brand Aesop

L'Oreal buys Aesop in $2.5 billion deal, its biggest acquisition ever

L'Oreal agrees to buy Aesop in $2.5 billion deal
Source: https://incomestatements.info
Category: Stock Reports
