See more : Zhangmen Education Inc. (ZME) Income Statement Analysis – Financial Results
Complete financial analysis of Lotus Resources Limited (LTSRF) income statement, including revenue, profit margins, EPS and key performance metrics. Get detailed insights into the financial performance of Lotus Resources Limited, a leading company in the Industrial Materials industry within the Basic Materials sector.
- Athena Constructions Limited (ATHCON.BO) Income Statement Analysis – Financial Results
- Jiangshan Oupai Door Industry Co., Ltd (603208.SS) Income Statement Analysis – Financial Results
- SNP Schneider-Neureither & Partner SE (SHF.DE) Income Statement Analysis – Financial Results
- Commerce Bancshares, Inc. (CBSH) Income Statement Analysis – Financial Results
- Endomines AB (publ) (ENDOM.HE) Income Statement Analysis – Financial Results
Lotus Resources Limited (LTSRF)
About Lotus Resources Limited
Lotus Resources Limited explores for, develops, and evaluates mineral properties in Australia and Africa. The company holds an 85% interest in the Kayelekera uranium project located in Malawi, Africa; and the Livingstonia project located in northern Malawi, southern Africa. The company was formerly known as Hylea Metals Limited and changed its name to Lotus Resources Limited in August 2019. Lotus Resources Limited was incorporated in 2006 and is based in Perth, Australia.
| Metric | 2024 | 2023 | 2022 | 2021 | 2020 | 2019 | 2018 | 2017 | 2016 | 2015 | 2014 | 2013 | 2012 | 2011 | 2010 | 2009 |
|---|---|---|---|---|---|---|---|---|---|---|---|---|---|---|---|---|
| Revenue | 21.16K | 102.47K | 2.38M | 127.11K | 109.67K | 37.44K | 190.10K | 28.26K | 20.42K | 30.64K | 72.25K | 217.26K | 0.00 | 0.00 | 0.00 | 117.39K |
| Cost of Revenue | 0.00 | 1.43M | 1.22K | 25.02K | 63.44K | 8.17K | 21.25K | 26.60K | 25.99K | 0.00 | 0.00 | 0.00 | 0.00 | 0.00 | 0.00 | 0.00 |
| Gross Profit | 21.16K | -1.33M | 2.37M | 102.09K | 46.23K | 29.28K | 168.85K | 1.66K | -5.57K | 30.64K | 72.25K | 217.26K | 0.00 | 0.00 | 0.00 | 117.39K |
| Gross Profit Ratio | 100.00% | -1,296.57% | 99.95% | 80.32% | 42.16% | 78.19% | 88.82% | 5.87% | -27.25% | 100.00% | 100.00% | 100.00% | 0.00% | 0.00% | 0.00% | 100.00% |
| Research & Development | 0.00 | 0.00 | 0.00 | 0.00 | 0.00 | 0.00 | 0.00 | 0.00 | 0.00 | 0.00 | 0.00 | 0.00 | 0.00 | 0.00 | 0.00 | 0.00 |
| General & Administrative | 3.61M | 4.64M | 6.41M | 2.96M | 1.25M | 790.89K | 904.61K | 1.10M | 488.10K | 563.59K | 473.37K | 861.95K | 1.05M | 995.60K | 717.19K | 436.61K |
| Selling & Marketing | 9.97M | 4.80M | 0.00 | 0.00 | 0.00 | 0.00 | 0.00 | 0.00 | 0.00 | 0.00 | 0.00 | 0.00 | 0.00 | 0.00 | 0.00 | 0.00 |
| SG&A | 13.57M | 9.44M | 6.41M | 2.96M | 1.25M | 790.89K | 904.61K | 1.10M | 488.10K | 563.59K | 473.37K | 861.95K | 1.05M | 995.60K | 717.19K | 436.61K |
| Other Expenses | 0.00 | 102.47K | 2.54M | 183.06K | 153.72K | 37.44K | 190.10K | 16.42K | 8.12K | 79.00 | 14.99K | 1.05K | 737.75K | -320.68K | 1.10K | 3.22K |
| Operating Expenses | 13.57M | 9.44M | 14.16M | 6.09M | 16.71M | 871.21K | 2.41M | 5.13M | 6.92M | 11.68M | 917.06K | 1.50M | 1.73M | 1.50M | 1.74M | 722.28K |
| Cost & Expenses | 13.57M | 10.87M | 14.16M | 6.09M | 16.71M | 871.21K | 2.41M | 5.13M | 6.92M | 11.68M | 917.06K | 1.50M | 1.73M | 1.50M | 1.74M | 722.28K |
| Interest Income | 1.65M | 1.09M | 37.61K | 4.57K | 6.61K | 4.24K | 25.68K | 11.84K | 12.31K | 30.64K | 57.25K | 217.26K | 562.30K | 249.83K | 187.55K | 0.00 |
| Interest Expense | 0.00 | 1.58M | 137.76K | 0.00 | 19.45K | 0.00 | 0.00 | 0.00 | 0.00 | 0.00 | 0.00 | 0.00 | 0.00 | 0.00 | 0.00 | 0.00 |
| Depreciation & Amortization | 2.74K | 1.43M | 1.22K | 25.02K | 63.44K | 8.17K | 21.25K | 26.60K | 25.99K | 26.00K | 16.00K | 26.43K | 30.54K | 41.19K | 28.24K | 18.45K |
| EBITDA | -13.55M | -8.25M | -11.58M | -5.96M | -16.49M | -817.22K | -2.39M | -5.10M | -6.89M | -11.66M | -901.07K | -1.48M | -1.70M | -1.46M | -1.71M | -586.45K |
| EBITDA Ratio | -64,060.00% | -9,215.12% | -487.48% | -4,767.73% | -15,033.75% | -2,305.15% | -1,255.65% | -18,054.94% | -33,762.03% | -38,045.13% | -1,247.15% | -678.94% | 0.00% | 0.00% | 0.00% | -499.59% |
| Operating Income | -13.55M | -10.87M | -11.58M | -6.09M | -16.55M | -871.21K | -2.41M | -5.13M | -6.92M | -11.68M | -917.06K | -1.50M | -1.73M | -1.50M | -1.74M | -604.90K |
| Operating Income Ratio | -64,060.00% | -10,611.69% | -487.53% | -4,787.41% | -15,091.59% | -2,326.96% | -1,266.82% | -18,149.06% | -33,889.28% | -38,129.97% | -1,269.29% | -691.10% | 0.00% | 0.00% | 0.00% | -515.30% |
| Total Other Income/Expenses | -11.67M | -1.01M | 1.03M | 59.90K | -12.75M | 4.02K | -1.21M | -3.20M | -6.30M | -10.93M | -269.04K | 45.00 | 1.33M | -29.67K | 210.50K | 3.22K |
| Income Before Tax | -25.22M | -10.35M | -12.96M | -5.90M | -16.57M | -821.36K | -2.17M | -5.07M | -6.87M | -11.63M | -828.83K | -1.26M | -396.27K | -1.53M | -1.53M | -601.68K |
| Income Before Tax Ratio | -119,202.40% | -10,099.73% | -545.63% | -4,639.81% | -15,109.32% | -2,193.81% | -1,142.14% | -17,954.94% | -33,662.02% | -37,944.87% | -1,147.16% | -578.46% | 0.00% | 0.00% | 0.00% | -512.56% |
| Income Tax Expense | 22.88K | 211.14K | 1.71M | -887.92K | -474.56K | -12.41K | -46.93K | -38.43K | -38.29K | -56.64K | -73.25K | -243.69K | -592.84K | -291.01K | -209.40K | 0.00 |
| Net Income | -24.51M | -9.92M | -12.00M | -5.01M | -15.92M | -821.36K | -2.17M | -5.07M | -6.87M | -11.63M | -828.83K | -1.26M | -396.27K | -1.53M | -1.53M | -601.68K |
| Net Income Ratio | -115,830.66% | -9,677.51% | -504.94% | -3,944.88% | -14,518.70% | -2,193.81% | -1,142.14% | -17,954.94% | -33,662.02% | -37,944.87% | -1,147.16% | -578.46% | 0.00% | 0.00% | 0.00% | -512.56% |
| EPS | -0.02 | -0.01 | -0.01 | -0.01 | -0.04 | -0.01 | -0.03 | -0.15 | -0.55 | -0.93 | -0.07 | -0.10 | -0.03 | -0.15 | -0.18 | -0.10 |
| EPS Diluted | -0.02 | -0.01 | -0.01 | -0.01 | -0.04 | -0.01 | -0.03 | -0.15 | -0.55 | -0.93 | -0.07 | -0.10 | -0.03 | -0.15 | -0.18 | -0.10 |
| Weighted Avg Shares Out | 1.59B | 1.31B | 1.17B | 820.58M | 361.57M | 129.35M | 73.01M | 33.99M | 12.50M | 12.50M | 12.50M | 12.50M | 12.50M | 9.98M | 8.62M | 5.95M |
| Weighted Avg Shares Out (Dil) | 1.59B | 1.31B | 1.17B | 820.58M | 361.57M | 129.35M | 73.01M | 33.99M | 12.50M | 12.50M | 12.50M | 12.50M | 12.50M | 9.98M | 8.62M | 5.95M |

Lotus Resources Announces Participation in 121 Mining Investment Conference in Cape Town
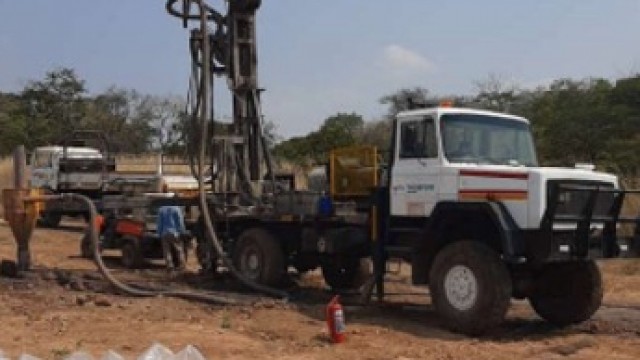
Lotus Resources expands uranium footprint at Kayelekera deposit
Lotus Resources appoints new CFO to further uranium ambitions

Lotus Resources initiated by Petra Capital with BUY rating and A$0.40 target price as uranium market heats up
Lotus Resources marks important milestone with inaugural sustainability report

Lotus Resources begins program of consolidation and expansion at historic uranium tenement

Lotus Resources shows potential for increasing both size and grades of uranium: Red Cloud Securities

Lotus Resources' Kayelekera Project positioned to become one of first projects to recommence uranium production
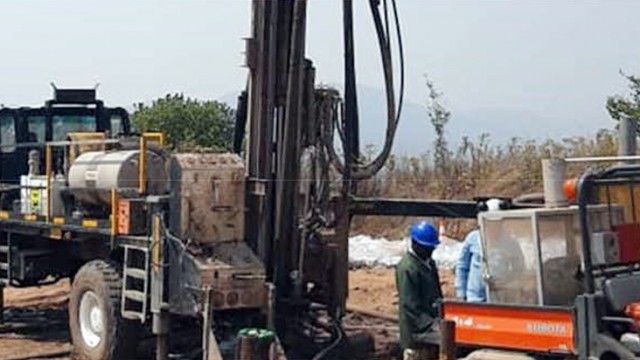
Lotus Resources kick-off drilling at high-grade Milenje Hills Rare Earth Prospect in Malawi

Lotus Resources granted 15-year licence extension on uranium project
Source: https://incomestatements.info
Category: Stock Reports
