See more : Sempra (SRE) Income Statement Analysis – Financial Results
Complete financial analysis of MAG Silver Corp. (MAG) income statement, including revenue, profit margins, EPS and key performance metrics. Get detailed insights into the financial performance of MAG Silver Corp., a leading company in the Silver industry within the Basic Materials sector.
- Aetherium Acquisition Corp. (GMFIW) Income Statement Analysis – Financial Results
- African Gold Acquisition Corpor (AGAC-WT) Income Statement Analysis – Financial Results
- Industria de Diseño Textil, S.A. (IDEXY) Income Statement Analysis – Financial Results
- Northrop Grumman Corporation (NOC) Income Statement Analysis – Financial Results
- VectoIQ Acquisition Corp. II (VTIQU) Income Statement Analysis – Financial Results
MAG Silver Corp. (MAG)
About MAG Silver Corp.
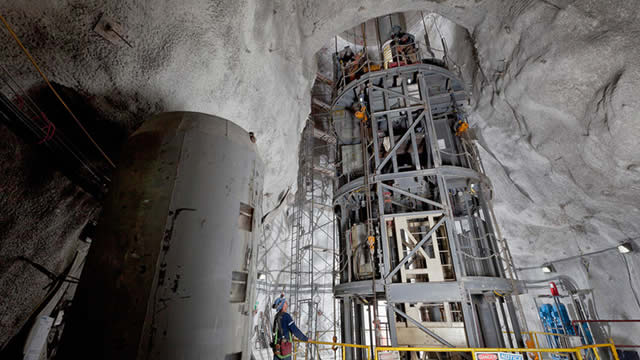
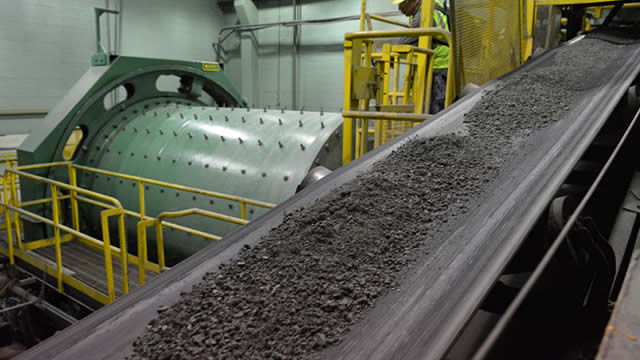
MAG Silver Corp. engages in the exploration and development of precious metal mining properties. The company explores for silver, gold, lead, and zinc deposits. It primarily holds 44% interest in the Juanicipio project located in the Fresnillo District, Zacatecas State, Mexico. The company is headquartered in Vancouver, Canada.
| Metric | 2023 | 2022 | 2021 | 2020 | 2019 | 2018 | 2017 | 2016 | 2015 | 2014 | 2013 | 2012 | 2011 | 2010 | 2009 | 2008 | 2007 | 2006 | 2005 | 2004 | 2003 | 2002 | 2001 |
|---|---|---|---|---|---|---|---|---|---|---|---|---|---|---|---|---|---|---|---|---|---|---|---|
| Revenue | 0.00 | 0.00 | 0.00 | 0.00 | 0.00 | 0.00 | 0.00 | 0.00 | 0.00 | 0.00 | 0.00 | 0.00 | 0.00 | 0.00 | 0.00 | 0.00 | 0.00 | 0.00 | 0.00 | 0.00 | 0.00 | 0.00 | 0.00 |
| Cost of Revenue | 358.46K | 130.61K | 146.00K | 121.00K | 106.00K | 15.00K | 20.00K | 23.00K | 16.24K | 35.19K | 35.75K | 44.30K | 0.00 | 0.00 | 0.00 | 0.00 | 0.00 | 0.00 | 0.00 | 0.00 | 0.00 | 0.00 | 0.00 |
| Gross Profit | -358.46K | -130.61K | -146.00K | -121.00K | -106.00K | -15.00K | -20.00K | -23.00K | -16.24K | -35.19K | -35.75K | -44.30K | 0.00 | 0.00 | 0.00 | 0.00 | 0.00 | 0.00 | 0.00 | 0.00 | 0.00 | 0.00 | 0.00 |
| Gross Profit Ratio | 0.00% | 0.00% | 0.00% | 0.00% | 0.00% | 0.00% | 0.00% | 0.00% | 0.00% | 0.00% | 0.00% | 0.00% | 0.00% | 0.00% | 0.00% | 0.00% | 0.00% | 0.00% | 0.00% | 0.00% | 0.00% | 0.00% | 0.00% |
| Research & Development | 0.00 | 0.00 | 0.00 | 0.00 | 0.00 | 0.00 | 0.00 | 0.00 | 0.00 | 0.00 | 0.00 | 0.00 | 0.00 | 0.00 | 0.00 | 0.00 | 0.00 | 0.00 | 0.00 | 0.00 | 0.00 | 0.00 | 0.00 |
| General & Administrative | 13.59M | 12.22M | 11.22M | 8.93M | 8.33M | 7.67M | 7.41M | 7.20M | 7.52M | 9.00M | 7.67M | 10.08M | 8.74M | 10.48M | 8.95M | 5.47M | 0.00 | 0.00 | 0.00 | 0.00 | 0.00 | 0.00 | 0.00 |
| Selling & Marketing | 736.00K | 0.00 | 0.00 | 0.00 | 0.00 | 0.00 | 0.00 | 0.00 | 0.00 | 0.00 | 0.00 | 0.00 | 0.00 | 0.00 | 0.00 | 0.00 | 0.00 | 0.00 | 0.00 | 0.00 | 0.00 | 0.00 | 0.00 |
| SG&A | 14.33M | 12.22M | 11.22M | 8.93M | 8.33M | 7.67M | 7.41M | 7.20M | 7.52M | 9.00M | 7.67M | 10.08M | 8.74M | 10.48M | 8.95M | 5.47M | 8.10M | 3.47M | 1.59M | 613.87K | 691.61K | 78.47K | 0.00 |
| Other Expenses | -65.10M | 329.00K | 102.00K | 38.00K | 577.00K | 1.12M | 1.09M | 257.00K | 216.66K | 0.00 | 354.58K | 0.00 | 59.57K | 76.75K | 662.28K | -40.44K | 14.05K | 14.43K | 15.81K | 9.62K | 1.44K | 0.00 | 181.19K |
| Operating Expenses | -50.77M | 12.55M | 11.32M | 8.97M | 8.90M | 8.79M | 8.50M | 7.45M | 7.73M | 9.00M | 8.03M | 10.08M | 8.80M | 10.55M | 9.61M | 5.43M | 8.12M | 3.48M | 1.60M | 623.49K | 693.05K | 78.47K | 181.19K |
| Cost & Expenses | -50.77M | 12.55M | 11.46M | 9.09M | 9.01M | 8.81M | 8.52M | 7.48M | 7.75M | 9.03M | 8.06M | 10.13M | 8.80M | 10.55M | 9.61M | 5.43M | 8.12M | 3.48M | 1.60M | 623.49K | 693.05K | 78.47K | 181.19K |
| Interest Income | 2.64M | 630.00K | 174.00K | 637.00K | 2.63M | 3.12M | 1.76M | 1.12M | 289.25K | 237.64K | 176.00K | 213.74K | 495.81K | 322.35K | 285.08K | 1.61M | 0.00 | 178.96K | 69.25K | 0.00 | 59.74K | 0.00 | 0.00 |
| Interest Expense | 0.00 | 0.00 | 57.49K | 67.38K | 68.56K | 0.00 | 0.00 | 0.00 | 0.00 | 0.00 | 48.67M | 0.00 | 0.00 | 0.00 | 3.14K | 2.75K | 0.00 | 1.90K | 1.57K | 0.00 | 12.56K | 0.00 | 0.00 |
| Depreciation & Amortization | 358.46K | 130.61K | 144.72K | 127.39K | 108.46K | 14.24K | 20.72K | 22.72K | 16.24K | 35.19K | 35.75K | 44.30K | 59.57K | 76.75K | 70.36K | 32.82K | 14.05K | 14.43K | 15.81K | 9.62K | 1.44K | 574.86 | 5.53K |
| EBITDA | -13.98M | -21.68M | -11.35M | -8.53M | -6.41M | -4.95M | -6.27M | -58.36M | -12.86M | -15.66M | -7.48M | -13.16M | -7.21M | -12.60M | -12.80M | -4.72M | -8.24M | -3.31M | -1.53M | -600.35K | 0.00 | -78.47K | -181.19K |
| EBITDA Ratio | 0.00% | 0.00% | 0.00% | 0.00% | 0.00% | 0.00% | 0.00% | 0.00% | 0.00% | 0.00% | 0.00% | 0.00% | 0.00% | 0.00% | 0.00% | 0.00% | 0.00% | 0.00% | 0.00% | 0.00% | 0.00% | 0.00% | 0.00% |
| Operating Income | 50.77M | 17.75M | -11.52M | -9.26M | -8.95M | -5.01M | -5.77M | -60.42M | -15.35M | -16.69M | 23.53M | -13.15M | -7.25M | -12.82M | -12.88M | -4.82M | -8.23M | 3.48M | 1.60M | -610.49K | 693.05K | -78.47K | -181.19K |
| Operating Income Ratio | 0.00% | 0.00% | 0.00% | 0.00% | 0.00% | 0.00% | 0.00% | 0.00% | 0.00% | 0.00% | 0.00% | 0.00% | 0.00% | 0.00% | 0.00% | 0.00% | 0.00% | 0.00% | 0.00% | 0.00% | 0.00% | 0.00% | 0.00% |
| Total Other Income/Expenses | 3.47M | 264.00K | 15.98M | 2.24M | 3.00M | 1.96M | 814.00K | -53.92M | -8.32M | -8.23M | -17.66M | -3.04M | 1.55M | -2.20M | -3.85M | 677.94K | -109.86K | 6.96M | 3.22M | 13.04K | 0.00 | 0.00 | 0.00 |
| Income Before Tax | 54.24M | 18.02M | 4.46M | -6.07M | -4.56M | -5.01M | -5.77M | -60.42M | -15.35M | -16.69M | -25.14M | -13.15M | -7.25M | -12.82M | -16.43M | -5.83M | -10.03M | 3.47M | 1.58M | -650.71K | 0.00 | 0.00 | 0.00 |
| Income Before Tax Ratio | 0.00% | 0.00% | 0.00% | 0.00% | 0.00% | 0.00% | 0.00% | 0.00% | 0.00% | 0.00% | 0.00% | 0.00% | 0.00% | 0.00% | 0.00% | 0.00% | 0.00% | 0.00% | 0.00% | 0.00% | 0.00% | 0.00% | 0.00% |
| Income Tax Expense | 5.58M | 371.00K | -1.57M | 1.03M | -131.00K | 796.00K | 728.00K | -4.58M | 1.48M | -552.38K | 4.23M | -840.05K | 836.75K | 2.27M | 3.14K | 2.75K | 111.98K | 6.80M | 3.16M | -13.00K | 1.34M | -574.86 | -5.53K |
| Net Income | 48.66M | 17.64M | 6.03M | -7.10M | -4.43M | -5.80M | -6.50M | -55.85M | -16.83M | -16.13M | -29.37M | -12.31M | -8.09M | -12.82M | -12.88M | -4.83M | -8.23M | -3.32M | -1.56M | -610.49K | -645.87K | -77.90K | -175.65K |
| Net Income Ratio | 0.00% | 0.00% | 0.00% | 0.00% | 0.00% | 0.00% | 0.00% | 0.00% | 0.00% | 0.00% | 0.00% | 0.00% | 0.00% | 0.00% | 0.00% | 0.00% | 0.00% | 0.00% | 0.00% | 0.00% | 0.00% | 0.00% | 0.00% |
| EPS | 0.47 | 0.17 | 0.06 | -0.08 | -0.05 | -0.07 | -0.08 | -0.71 | -0.24 | -0.25 | -0.49 | -0.22 | -0.15 | -0.24 | -0.26 | -0.10 | -0.19 | -0.09 | -0.06 | -0.02 | -0.04 | -0.02 | -0.06 |
| EPS Diluted | 0.47 | 0.17 | 0.06 | -0.08 | -0.05 | -0.07 | -0.08 | -0.71 | -0.24 | -0.25 | -0.49 | -0.22 | -0.15 | -0.24 | -0.26 | -0.10 | -0.19 | -0.09 | -0.06 | -0.02 | -0.04 | -0.02 | -0.06 |
| Weighted Avg Shares Out | 103.53M | 98.42M | 95.18M | 91.11M | 86.14M | 85.52M | 81.18M | 78.48M | 69.21M | 64.11M | 60.13M | 57.08M | 55.47M | 52.86M | 49.25M | 48.79M | 42.41M | 37.06M | 28.35M | 24.58M | 14.46M | 3.49M | 3.00M |
| Weighted Avg Shares Out (Dil) | 102.63M | 98.56M | 95.46M | 91.11M | 86.14M | 85.52M | 81.18M | 78.48M | 69.21M | 64.11M | 60.13M | 57.08M | 55.47M | 52.86M | 49.25M | 48.79M | 42.41M | 37.06M | 28.35M | 25.57M | 14.46M | 3.49M | 3.00M |

MAG Silver: Excellent Valuation Makes This A Compelling Investment, Rating Upgrade

MAG Silver's (MAG) Juanicipio Starts Commercial Production

MAG Silver reports Juanicipio achieved commercial production

MAG Silver (MAG) Q1 Earnings Miss Estimates, Up Y/Y

Why Shares of Hecla Mining, MAG Silver, and Sibanye Stillwater Are Plummeting This Week

7 Ways to Play Silver Before Prices Go Parabolic

MAG Silver: Quality For A Good Price

MAG Silver's (MAG) Q4 Earnings Miss Estimates, Down Y/Y

7 Silver Stocks to Buy Amid the Banking Sector Fallout

MDA Breakout Stocks/ETFs Week 13 - March 2023: High-Frequency Gainers To Give You An Edge
Source: https://incomestatements.info
Category: Stock Reports
