See more : Ecoloclean Industries, Inc. (ECCI) Income Statement Analysis – Financial Results
Complete financial analysis of MAG Silver Corp. (MAG) income statement, including revenue, profit margins, EPS and key performance metrics. Get detailed insights into the financial performance of MAG Silver Corp., a leading company in the Silver industry within the Basic Materials sector.
- Powerlinx Inc. (PWNX) Income Statement Analysis – Financial Results
- BCB Bancorp, Inc. (BCBP) Income Statement Analysis – Financial Results
- Permanent Technologies, Inc. (PERT) Income Statement Analysis – Financial Results
- Keppel Corporation Limited (BN4.SI) Income Statement Analysis – Financial Results
- Vox Royalty Corp. (VOXR.TO) Income Statement Analysis – Financial Results
MAG Silver Corp. (MAG)
About MAG Silver Corp.
MAG Silver Corp. engages in the exploration and development of precious metal mining properties. The company explores for silver, gold, lead, and zinc deposits. It primarily holds 44% interest in the Juanicipio project located in the Fresnillo District, Zacatecas State, Mexico. The company is headquartered in Vancouver, Canada.
| Metric | 2023 | 2022 | 2021 | 2020 | 2019 | 2018 | 2017 | 2016 | 2015 | 2014 | 2013 | 2012 | 2011 | 2010 | 2009 | 2008 | 2007 | 2006 | 2005 | 2004 | 2003 | 2002 | 2001 |
|---|---|---|---|---|---|---|---|---|---|---|---|---|---|---|---|---|---|---|---|---|---|---|---|
| Revenue | 0.00 | 0.00 | 0.00 | 0.00 | 0.00 | 0.00 | 0.00 | 0.00 | 0.00 | 0.00 | 0.00 | 0.00 | 0.00 | 0.00 | 0.00 | 0.00 | 0.00 | 0.00 | 0.00 | 0.00 | 0.00 | 0.00 | 0.00 |
| Cost of Revenue | 358.46K | 130.61K | 146.00K | 121.00K | 106.00K | 15.00K | 20.00K | 23.00K | 16.24K | 35.19K | 35.75K | 44.30K | 0.00 | 0.00 | 0.00 | 0.00 | 0.00 | 0.00 | 0.00 | 0.00 | 0.00 | 0.00 | 0.00 |
| Gross Profit | -358.46K | -130.61K | -146.00K | -121.00K | -106.00K | -15.00K | -20.00K | -23.00K | -16.24K | -35.19K | -35.75K | -44.30K | 0.00 | 0.00 | 0.00 | 0.00 | 0.00 | 0.00 | 0.00 | 0.00 | 0.00 | 0.00 | 0.00 |
| Gross Profit Ratio | 0.00% | 0.00% | 0.00% | 0.00% | 0.00% | 0.00% | 0.00% | 0.00% | 0.00% | 0.00% | 0.00% | 0.00% | 0.00% | 0.00% | 0.00% | 0.00% | 0.00% | 0.00% | 0.00% | 0.00% | 0.00% | 0.00% | 0.00% |
| Research & Development | 0.00 | 0.00 | 0.00 | 0.00 | 0.00 | 0.00 | 0.00 | 0.00 | 0.00 | 0.00 | 0.00 | 0.00 | 0.00 | 0.00 | 0.00 | 0.00 | 0.00 | 0.00 | 0.00 | 0.00 | 0.00 | 0.00 | 0.00 |
| General & Administrative | 13.59M | 12.22M | 11.22M | 8.93M | 8.33M | 7.67M | 7.41M | 7.20M | 7.52M | 9.00M | 7.67M | 10.08M | 8.74M | 10.48M | 8.95M | 5.47M | 0.00 | 0.00 | 0.00 | 0.00 | 0.00 | 0.00 | 0.00 |
| Selling & Marketing | 736.00K | 0.00 | 0.00 | 0.00 | 0.00 | 0.00 | 0.00 | 0.00 | 0.00 | 0.00 | 0.00 | 0.00 | 0.00 | 0.00 | 0.00 | 0.00 | 0.00 | 0.00 | 0.00 | 0.00 | 0.00 | 0.00 | 0.00 |
| SG&A | 14.33M | 12.22M | 11.22M | 8.93M | 8.33M | 7.67M | 7.41M | 7.20M | 7.52M | 9.00M | 7.67M | 10.08M | 8.74M | 10.48M | 8.95M | 5.47M | 8.10M | 3.47M | 1.59M | 613.87K | 691.61K | 78.47K | 0.00 |
| Other Expenses | -65.10M | 329.00K | 102.00K | 38.00K | 577.00K | 1.12M | 1.09M | 257.00K | 216.66K | 0.00 | 354.58K | 0.00 | 59.57K | 76.75K | 662.28K | -40.44K | 14.05K | 14.43K | 15.81K | 9.62K | 1.44K | 0.00 | 181.19K |
| Operating Expenses | -50.77M | 12.55M | 11.32M | 8.97M | 8.90M | 8.79M | 8.50M | 7.45M | 7.73M | 9.00M | 8.03M | 10.08M | 8.80M | 10.55M | 9.61M | 5.43M | 8.12M | 3.48M | 1.60M | 623.49K | 693.05K | 78.47K | 181.19K |
| Cost & Expenses | -50.77M | 12.55M | 11.46M | 9.09M | 9.01M | 8.81M | 8.52M | 7.48M | 7.75M | 9.03M | 8.06M | 10.13M | 8.80M | 10.55M | 9.61M | 5.43M | 8.12M | 3.48M | 1.60M | 623.49K | 693.05K | 78.47K | 181.19K |
| Interest Income | 2.64M | 630.00K | 174.00K | 637.00K | 2.63M | 3.12M | 1.76M | 1.12M | 289.25K | 237.64K | 176.00K | 213.74K | 495.81K | 322.35K | 285.08K | 1.61M | 0.00 | 178.96K | 69.25K | 0.00 | 59.74K | 0.00 | 0.00 |
| Interest Expense | 0.00 | 0.00 | 57.49K | 67.38K | 68.56K | 0.00 | 0.00 | 0.00 | 0.00 | 0.00 | 48.67M | 0.00 | 0.00 | 0.00 | 3.14K | 2.75K | 0.00 | 1.90K | 1.57K | 0.00 | 12.56K | 0.00 | 0.00 |
| Depreciation & Amortization | 358.46K | 130.61K | 144.72K | 127.39K | 108.46K | 14.24K | 20.72K | 22.72K | 16.24K | 35.19K | 35.75K | 44.30K | 59.57K | 76.75K | 70.36K | 32.82K | 14.05K | 14.43K | 15.81K | 9.62K | 1.44K | 574.86 | 5.53K |
| EBITDA | -13.98M | -21.68M | -11.35M | -8.53M | -6.41M | -4.95M | -6.27M | -58.36M | -12.86M | -15.66M | -7.48M | -13.16M | -7.21M | -12.60M | -12.80M | -4.72M | -8.24M | -3.31M | -1.53M | -600.35K | 0.00 | -78.47K | -181.19K |
| EBITDA Ratio | 0.00% | 0.00% | 0.00% | 0.00% | 0.00% | 0.00% | 0.00% | 0.00% | 0.00% | 0.00% | 0.00% | 0.00% | 0.00% | 0.00% | 0.00% | 0.00% | 0.00% | 0.00% | 0.00% | 0.00% | 0.00% | 0.00% | 0.00% |
| Operating Income | 50.77M | 17.75M | -11.52M | -9.26M | -8.95M | -5.01M | -5.77M | -60.42M | -15.35M | -16.69M | 23.53M | -13.15M | -7.25M | -12.82M | -12.88M | -4.82M | -8.23M | 3.48M | 1.60M | -610.49K | 693.05K | -78.47K | -181.19K |
| Operating Income Ratio | 0.00% | 0.00% | 0.00% | 0.00% | 0.00% | 0.00% | 0.00% | 0.00% | 0.00% | 0.00% | 0.00% | 0.00% | 0.00% | 0.00% | 0.00% | 0.00% | 0.00% | 0.00% | 0.00% | 0.00% | 0.00% | 0.00% | 0.00% |
| Total Other Income/Expenses | 3.47M | 264.00K | 15.98M | 2.24M | 3.00M | 1.96M | 814.00K | -53.92M | -8.32M | -8.23M | -17.66M | -3.04M | 1.55M | -2.20M | -3.85M | 677.94K | -109.86K | 6.96M | 3.22M | 13.04K | 0.00 | 0.00 | 0.00 |
| Income Before Tax | 54.24M | 18.02M | 4.46M | -6.07M | -4.56M | -5.01M | -5.77M | -60.42M | -15.35M | -16.69M | -25.14M | -13.15M | -7.25M | -12.82M | -16.43M | -5.83M | -10.03M | 3.47M | 1.58M | -650.71K | 0.00 | 0.00 | 0.00 |
| Income Before Tax Ratio | 0.00% | 0.00% | 0.00% | 0.00% | 0.00% | 0.00% | 0.00% | 0.00% | 0.00% | 0.00% | 0.00% | 0.00% | 0.00% | 0.00% | 0.00% | 0.00% | 0.00% | 0.00% | 0.00% | 0.00% | 0.00% | 0.00% | 0.00% |
| Income Tax Expense | 5.58M | 371.00K | -1.57M | 1.03M | -131.00K | 796.00K | 728.00K | -4.58M | 1.48M | -552.38K | 4.23M | -840.05K | 836.75K | 2.27M | 3.14K | 2.75K | 111.98K | 6.80M | 3.16M | -13.00K | 1.34M | -574.86 | -5.53K |
| Net Income | 48.66M | 17.64M | 6.03M | -7.10M | -4.43M | -5.80M | -6.50M | -55.85M | -16.83M | -16.13M | -29.37M | -12.31M | -8.09M | -12.82M | -12.88M | -4.83M | -8.23M | -3.32M | -1.56M | -610.49K | -645.87K | -77.90K | -175.65K |
| Net Income Ratio | 0.00% | 0.00% | 0.00% | 0.00% | 0.00% | 0.00% | 0.00% | 0.00% | 0.00% | 0.00% | 0.00% | 0.00% | 0.00% | 0.00% | 0.00% | 0.00% | 0.00% | 0.00% | 0.00% | 0.00% | 0.00% | 0.00% | 0.00% |
| EPS | 0.47 | 0.17 | 0.06 | -0.08 | -0.05 | -0.07 | -0.08 | -0.71 | -0.24 | -0.25 | -0.49 | -0.22 | -0.15 | -0.24 | -0.26 | -0.10 | -0.19 | -0.09 | -0.06 | -0.02 | -0.04 | -0.02 | -0.06 |
| EPS Diluted | 0.47 | 0.17 | 0.06 | -0.08 | -0.05 | -0.07 | -0.08 | -0.71 | -0.24 | -0.25 | -0.49 | -0.22 | -0.15 | -0.24 | -0.26 | -0.10 | -0.19 | -0.09 | -0.06 | -0.02 | -0.04 | -0.02 | -0.06 |
| Weighted Avg Shares Out | 103.53M | 98.42M | 95.18M | 91.11M | 86.14M | 85.52M | 81.18M | 78.48M | 69.21M | 64.11M | 60.13M | 57.08M | 55.47M | 52.86M | 49.25M | 48.79M | 42.41M | 37.06M | 28.35M | 24.58M | 14.46M | 3.49M | 3.00M |
| Weighted Avg Shares Out (Dil) | 102.63M | 98.56M | 95.46M | 91.11M | 86.14M | 85.52M | 81.18M | 78.48M | 69.21M | 64.11M | 60.13M | 57.08M | 55.47M | 52.86M | 49.25M | 48.79M | 42.41M | 37.06M | 28.35M | 25.57M | 14.46M | 3.49M | 3.00M |

MAG Silver Reports Third Quarter Financial Results
MAG Silver (MAG) Investor Presentation - Slideshow
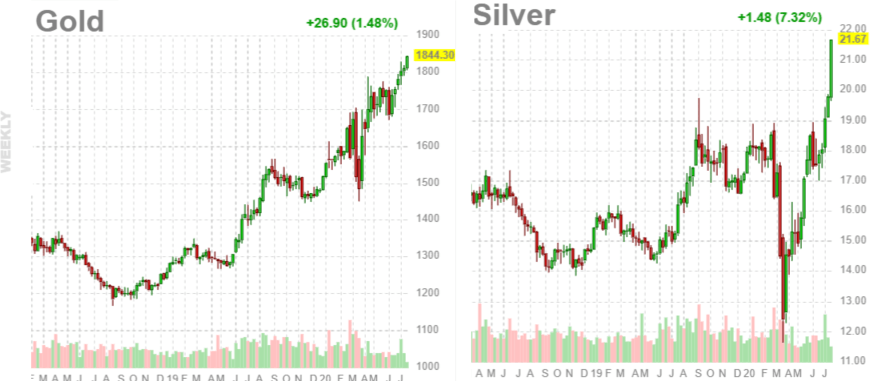
A Short Squeeze Can Push These Gold And Silver Miners Even Higher
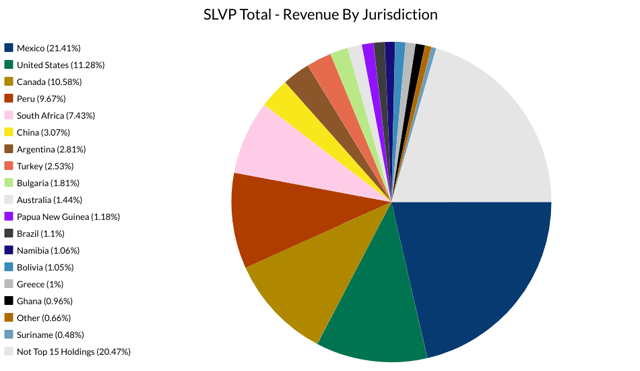
SLVP Top 15 Holdings And Their Mining Jurisdictions
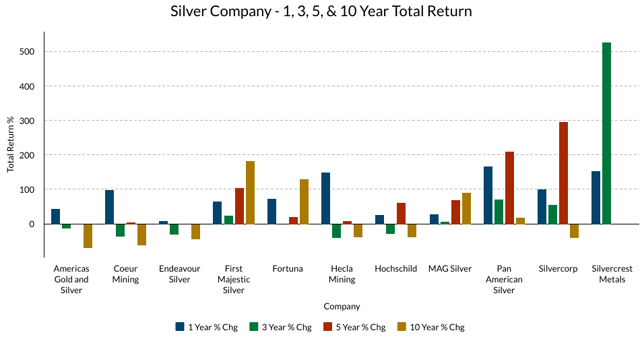
Silver Miners And Their Historical Performance - 2020 Edition
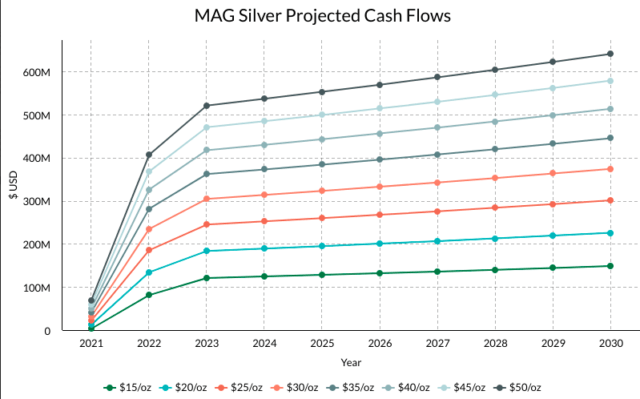
MAG Silver And Its Projected Cash Flows From Mining Operations

The Benefits Of Physical Precious Metals Ownership Vs. The Derivatives

Barrington Maintains a Buy Rating on Columbus Mckinnon (CMCO)
Source: https://incomestatements.info
Category: Stock Reports
