See more : Vixtel Technologies Holdings Limited (1782.HK) Income Statement Analysis – Financial Results
Complete financial analysis of MGC Pharmaceuticals Limited (MGCLF) income statement, including revenue, profit margins, EPS and key performance metrics. Get detailed insights into the financial performance of MGC Pharmaceuticals Limited, a leading company in the Drug Manufacturers – Specialty & Generic industry within the Healthcare sector.
- Westward Gold Inc. (WGLIF) Income Statement Analysis – Financial Results
- Kretto Syscon Limited (KRETTOSYS.BO) Income Statement Analysis – Financial Results
- Green Cross Corporation (006280.KS) Income Statement Analysis – Financial Results
- ASIRO Inc. (7378.T) Income Statement Analysis – Financial Results
- COPT Defense Properties (CDP) Income Statement Analysis – Financial Results
MGC Pharmaceuticals Limited (MGCLF)
Industry: Drug Manufacturers - Specialty & Generic
Sector: Healthcare
Website: https://mgcpharma.com.au
About MGC Pharmaceuticals Limited
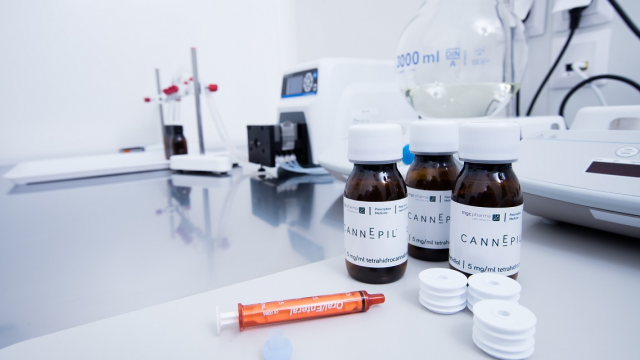
MGC Pharmaceuticals Limited, a bio-pharma company, develops and supplies phytomedicines in worldwide. The company produces and supplies medicinal cannabis products; and non-cannabis phytomedicines. Its principal product candidates include CimetrA, which is in phase III clinical trial for the symptomatic treatment of early COVID-19; CannEpil, a phase IIb cannabis-based therapy for drug-resistant Epilepsy; and CogniCann that is in phase II clinical trial for the symptomatic relief of Dementia. The company also provides ArtemiC range of products and cannabinoid products, as well as non-pharma products. In addition, it offers consulting services, including clinical research services. The company was formerly known as Erin Resources Limited and changed its name to MGC Pharmaceuticals Limited in December 2015. MGC Pharmaceuticals Limited was founded in 2014 and is based in West Perth, Australia.
| Metric | 2023 | 2022 | 2021 | 2020 | 2019 | 2018 | 2017 | 2016 | 2015 | 2014 | 2013 | 2012 | 2011 | 2010 | 2009 | 2008 | 2007 | 2006 |
|---|---|---|---|---|---|---|---|---|---|---|---|---|---|---|---|---|---|---|
| Revenue | 3.39M | 4.65M | 2.96M | 2.03M | 656.24K | 296.81K | 120.24K | 2.20K | 0.00 | 0.00 | 0.00 | 0.00 | 0.00 | 351.66K | 2.11M | 1.91M | 2.63M | 0.00 |
| Cost of Revenue | 1.94M | 3.01M | 1.65M | 1.90M | 356.64K | 119.34K | 158.07K | 15.01K | 0.00 | 0.00 | 0.00 | 0.00 | 0.00 | 0.00 | 0.00 | 0.00 | 0.00 | 0.00 |
| Gross Profit | 1.45M | 1.63M | 1.31M | 130.15K | 299.60K | 177.47K | -37.83K | -12.81K | 0.00 | 0.00 | 0.00 | 0.00 | 0.00 | 351.66K | 2.11M | 1.91M | 2.63M | 0.00 |
| Gross Profit Ratio | 42.82% | 35.15% | 44.23% | 6.40% | 45.65% | 59.79% | -31.46% | -583.25% | 0.00% | 0.00% | 0.00% | 0.00% | 0.00% | 100.00% | 100.00% | 100.00% | 100.00% | 0.00% |
| Research & Development | 1.99M | 4.24M | 5.86M | 5.37M | 2.87M | 951.32K | 0.00 | 0.00 | 0.00 | 0.00 | 0.00 | 0.00 | 0.00 | 0.00 | 0.00 | 0.00 | 0.00 | 0.00 |
| General & Administrative | 12.13M | 8.28M | 5.73M | 6.61M | 2.61M | 3.36M | 4.27M | 683.09K | 510.09K | 244.11K | 362.77K | 101.01K | 98.33K | 1.43M | 1.70M | 1.39M | 1.03M | 0.00 |
| Selling & Marketing | 926.91K | 949.83K | 583.19K | 562.13K | 574.98K | 612.76K | 204.76K | 240.26K | 36.39K | 12.33K | 9.38K | 3.16K | 4.83K | 223.63K | 326.02K | 477.93K | 462.40K | 0.00 |
| SG&A | 13.06M | 9.23M | 6.31M | 6.61M | 3.19M | 3.97M | 4.47M | 923.35K | 546.48K | 256.43K | 372.16K | 104.17K | 103.17K | 1.65M | 2.03M | 1.86M | 1.49M | 0.00 |
| Other Expenses | -578.77K | -1.18M | -425.12K | 524.32K | 9.46M | -1.79M | -1.29M | -1.78M | -6.51K | 1.60K | -27.35K | 15.00K | 28.39K | 951.09K | 155.02K | 27.97K | 2.59M | 0.00 |
| Operating Expenses | 17.05M | 15.08M | 13.38M | 12.55M | 9.34M | 7.44M | 7.28M | 4.36M | 3.80M | 5.35M | 765.21K | 343.94K | 252.45K | 3.08M | 3.64M | 3.55M | 2.68M | 0.00 |
| Cost & Expenses | 24.26M | 18.10M | 15.03M | 14.45M | 9.70M | 7.56M | 7.44M | 4.38M | 3.80M | 5.35M | 765.21K | 343.94K | 252.45K | 3.08M | 3.64M | 3.55M | 2.68M | 0.00 |
| Interest Income | 240.00 | 300.00 | 7.63K | 12.34K | 201.85K | 191.59K | 127.26K | 46.03K | 5.89K | 7.10K | 25.66K | 38.06K | 7.12K | 759.08K | 390.37K | 27.97K | 40.94K | 0.00 |
| Interest Expense | 257.40K | 190.05K | 369.14K | 135.58K | 8.00K | 99.37K | 19.72K | 120.01K | 0.00 | 0.00 | 0.00 | 0.00 | 95.14K | 1.74M | 573.54K | 11.34K | 25.89K | 0.00 |
| Depreciation & Amortization | 751.94K | 504.30K | 491.41K | 481.13K | 259.74K | 328.11K | 83.52K | 16.58K | 0.00 | 0.00 | 8.33K | 0.00 | 0.00 | 166.64K | 35.47K | 47.60K | 40.48K | 0.00 |
| EBITDA | -14.69M | -15.16M | -12.00M | -13.04M | -8.45M | -8.54M | -8.40M | -6.09M | -3.80M | -5.35M | -756.87K | -343.94K | -216.95K | -855.93K | -1.34M | -1.57M | -55.88K | 0.00 |
| EBITDA Ratio | -455.34% | -303.90% | -404.87% | -443.15% | 134.22% | -2,875.65% | -6,984.90% | -277,354.48% | 0.00% | 0.00% | 0.00% | 0.00% | 0.00% | -243.40% | -63.32% | -82.21% | -2.13% | 0.00% |
| Operating Income | -15.23M | -14.63M | -12.49M | -9.50M | 621.07K | -8.86M | -8.48M | -6.11M | -3.80M | -5.35M | -765.21K | -343.94K | -216.95K | -1.02M | -1.37M | -1.61M | -96.37K | 0.00 |
| Operating Income Ratio | -449.72% | -314.75% | -421.46% | -466.80% | 94.64% | -2,986.19% | -7,054.36% | -278,109.10% | 0.00% | 0.00% | 0.00% | 0.00% | 0.00% | -290.78% | -65.00% | -84.70% | -3.67% | 0.00% |
| Total Other Income/Expenses | -5.90M | -1.64M | -1.59M | -7.48M | 6.84M | -1.94M | -1.21M | -2.01M | -166.94K | -2.65K | -27.35K | 53.06K | -232.49K | -2.16M | -573.54K | -11.34K | 14.60K | 0.00 |
| Income Before Tax | -21.13M | -17.14M | -13.53M | -18.81M | -1.88M | -8.99M | -8.50M | -6.23M | -3.80M | -5.34M | -766.90K | -290.88K | -449.44K | -3.18M | -1.95M | -1.63M | -81.77K | 0.00 |
| Income Before Tax Ratio | -623.80% | -368.81% | -456.71% | -924.70% | -285.93% | -3,029.02% | -7,070.76% | -283,571.37% | 0.00% | 0.00% | 0.00% | 0.00% | 0.00% | -904.30% | -92.17% | -85.30% | -3.11% | 0.00% |
| Income Tax Expense | 2.02K | -1.36M | -27.28K | 1.21M | 27.32K | -1.04K | -1.63M | -1.73M | 0.00 | 0.00 | -25.66K | 0.00 | -117.28K | 2.14M | 728.55K | 251.84K | 2.57M | 0.00 |
| Net Income | -20.82M | -16.77M | -13.97M | -19.36M | -2.31M | -8.25M | -8.14M | -6.16M | -3.80M | -5.34M | -766.90K | -290.88K | 1.94M | -2.63M | -1.95M | -1.88M | -81.77K | 0.00 |
| Net Income Ratio | -614.71% | -360.79% | -471.33% | -951.67% | -351.91% | -2,778.31% | -6,773.31% | -280,252.34% | 0.00% | 0.00% | 0.00% | 0.00% | 0.00% | -748.06% | -92.17% | -98.51% | -3.11% | 0.00% |
| EPS | -7.07 | -6.53 | -7.33 | -14.01 | -1.91 | -7.33 | -8.43 | -10.20 | -13.43 | -33.40 | -11.83 | -11.25 | 156.00 | -326.13 | -244.95 | -236.36 | -11.07 | 0.00 |
| EPS Diluted | -7.07 | -6.53 | -7.33 | -14.01 | -1.91 | -7.33 | -8.43 | -10.20 | -13.43 | -33.37 | -11.83 | -11.25 | 156.00 | -326.13 | -244.95 | -236.36 | -11.07 | 0.00 |
| Weighted Avg Shares Out | 2.95M | 2.57M | 1.91M | 1.38M | 1.21M | 1.13M | 966.34K | 603.56K | 282.81K | 159.81K | 64.81K | 25.86K | 12.40K | 8.07K | 7.94K | 7.94K | 7.39K | 7.39K |
| Weighted Avg Shares Out (Dil) | 2.95M | 2.57M | 1.91M | 1.38M | 1.21M | 1.13M | 966.34K | 603.56K | 282.81K | 159.96K | 64.81K | 25.86K | 12.40K | 8.07K | 7.94K | 7.94K | 7.39K | 7.39K |

MGC Pharmaceuticals hails US partnership as AMC orders possible COVID-19 treatment

MGC Pharmaceuticals' US commercial partnership gaining early traction

MGC Pharmaceuticals says ArtemiC gets green light for EU sales; Indian trial shows efficacy in severe COVID-19 patients

MGC Pharmaceuticals gets green light for EU sales, Indian trial shows efficacy in severe COVID-19 patients

MGC Pharmaceuticals boosted by UK import approval

MGC Pharmaceuticals reports strong phytocannabanoid sales

MGC Pharmaceuticals delivers year of growth for 2021 with phytocannabanoid sales totalling A$2 million

MGC Pharmaceuticals delivers 'significant' year of growth for 2021 with phytocannabanoid sales totalling A$2 million

MGC Pharmaceuticals: plant-based treatment to address unmet medical needs

MGC Pharmaceuticals reports record quarterly sales
Source: https://incomestatements.info
Category: Stock Reports
