See more : UTour Group Co., Ltd. (002707.SZ) Income Statement Analysis – Financial Results
Complete financial analysis of MGC Pharmaceuticals Limited (MGCLF) income statement, including revenue, profit margins, EPS and key performance metrics. Get detailed insights into the financial performance of MGC Pharmaceuticals Limited, a leading company in the Drug Manufacturers – Specialty & Generic industry within the Healthcare sector.
- Evotec SE (0IRF.IL) Income Statement Analysis – Financial Results
- South Dakota Soybean Processors, LLC (SDSYA) Income Statement Analysis – Financial Results
- NLS Pharmaceutics AG (NLSPW) Income Statement Analysis – Financial Results
- Median Technologies SA (ALMDT.PA) Income Statement Analysis – Financial Results
- Hydratec Industries NV (HYDRA.AS) Income Statement Analysis – Financial Results
MGC Pharmaceuticals Limited (MGCLF)
Industry: Drug Manufacturers - Specialty & Generic
Sector: Healthcare
Website: https://mgcpharma.com.au
About MGC Pharmaceuticals Limited
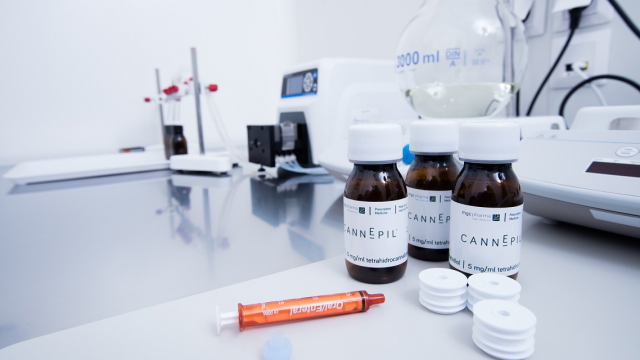
MGC Pharmaceuticals Limited, a bio-pharma company, develops and supplies phytomedicines in worldwide. The company produces and supplies medicinal cannabis products; and non-cannabis phytomedicines. Its principal product candidates include CimetrA, which is in phase III clinical trial for the symptomatic treatment of early COVID-19; CannEpil, a phase IIb cannabis-based therapy for drug-resistant Epilepsy; and CogniCann that is in phase II clinical trial for the symptomatic relief of Dementia. The company also provides ArtemiC range of products and cannabinoid products, as well as non-pharma products. In addition, it offers consulting services, including clinical research services. The company was formerly known as Erin Resources Limited and changed its name to MGC Pharmaceuticals Limited in December 2015. MGC Pharmaceuticals Limited was founded in 2014 and is based in West Perth, Australia.
| Metric | 2023 | 2022 | 2021 | 2020 | 2019 | 2018 | 2017 | 2016 | 2015 | 2014 | 2013 | 2012 | 2011 | 2010 | 2009 | 2008 | 2007 | 2006 |
|---|---|---|---|---|---|---|---|---|---|---|---|---|---|---|---|---|---|---|
| Revenue | 3.39M | 4.65M | 2.96M | 2.03M | 656.24K | 296.81K | 120.24K | 2.20K | 0.00 | 0.00 | 0.00 | 0.00 | 0.00 | 351.66K | 2.11M | 1.91M | 2.63M | 0.00 |
| Cost of Revenue | 1.94M | 3.01M | 1.65M | 1.90M | 356.64K | 119.34K | 158.07K | 15.01K | 0.00 | 0.00 | 0.00 | 0.00 | 0.00 | 0.00 | 0.00 | 0.00 | 0.00 | 0.00 |
| Gross Profit | 1.45M | 1.63M | 1.31M | 130.15K | 299.60K | 177.47K | -37.83K | -12.81K | 0.00 | 0.00 | 0.00 | 0.00 | 0.00 | 351.66K | 2.11M | 1.91M | 2.63M | 0.00 |
| Gross Profit Ratio | 42.82% | 35.15% | 44.23% | 6.40% | 45.65% | 59.79% | -31.46% | -583.25% | 0.00% | 0.00% | 0.00% | 0.00% | 0.00% | 100.00% | 100.00% | 100.00% | 100.00% | 0.00% |
| Research & Development | 1.99M | 4.24M | 5.86M | 5.37M | 2.87M | 951.32K | 0.00 | 0.00 | 0.00 | 0.00 | 0.00 | 0.00 | 0.00 | 0.00 | 0.00 | 0.00 | 0.00 | 0.00 |
| General & Administrative | 12.13M | 8.28M | 5.73M | 6.61M | 2.61M | 3.36M | 4.27M | 683.09K | 510.09K | 244.11K | 362.77K | 101.01K | 98.33K | 1.43M | 1.70M | 1.39M | 1.03M | 0.00 |
| Selling & Marketing | 926.91K | 949.83K | 583.19K | 562.13K | 574.98K | 612.76K | 204.76K | 240.26K | 36.39K | 12.33K | 9.38K | 3.16K | 4.83K | 223.63K | 326.02K | 477.93K | 462.40K | 0.00 |
| SG&A | 13.06M | 9.23M | 6.31M | 6.61M | 3.19M | 3.97M | 4.47M | 923.35K | 546.48K | 256.43K | 372.16K | 104.17K | 103.17K | 1.65M | 2.03M | 1.86M | 1.49M | 0.00 |
| Other Expenses | -578.77K | -1.18M | -425.12K | 524.32K | 9.46M | -1.79M | -1.29M | -1.78M | -6.51K | 1.60K | -27.35K | 15.00K | 28.39K | 951.09K | 155.02K | 27.97K | 2.59M | 0.00 |
| Operating Expenses | 17.05M | 15.08M | 13.38M | 12.55M | 9.34M | 7.44M | 7.28M | 4.36M | 3.80M | 5.35M | 765.21K | 343.94K | 252.45K | 3.08M | 3.64M | 3.55M | 2.68M | 0.00 |
| Cost & Expenses | 24.26M | 18.10M | 15.03M | 14.45M | 9.70M | 7.56M | 7.44M | 4.38M | 3.80M | 5.35M | 765.21K | 343.94K | 252.45K | 3.08M | 3.64M | 3.55M | 2.68M | 0.00 |
| Interest Income | 240.00 | 300.00 | 7.63K | 12.34K | 201.85K | 191.59K | 127.26K | 46.03K | 5.89K | 7.10K | 25.66K | 38.06K | 7.12K | 759.08K | 390.37K | 27.97K | 40.94K | 0.00 |
| Interest Expense | 257.40K | 190.05K | 369.14K | 135.58K | 8.00K | 99.37K | 19.72K | 120.01K | 0.00 | 0.00 | 0.00 | 0.00 | 95.14K | 1.74M | 573.54K | 11.34K | 25.89K | 0.00 |
| Depreciation & Amortization | 751.94K | 504.30K | 491.41K | 481.13K | 259.74K | 328.11K | 83.52K | 16.58K | 0.00 | 0.00 | 8.33K | 0.00 | 0.00 | 166.64K | 35.47K | 47.60K | 40.48K | 0.00 |
| EBITDA | -14.69M | -15.16M | -12.00M | -13.04M | -8.45M | -8.54M | -8.40M | -6.09M | -3.80M | -5.35M | -756.87K | -343.94K | -216.95K | -855.93K | -1.34M | -1.57M | -55.88K | 0.00 |
| EBITDA Ratio | -455.34% | -303.90% | -404.87% | -443.15% | 134.22% | -2,875.65% | -6,984.90% | -277,354.48% | 0.00% | 0.00% | 0.00% | 0.00% | 0.00% | -243.40% | -63.32% | -82.21% | -2.13% | 0.00% |
| Operating Income | -15.23M | -14.63M | -12.49M | -9.50M | 621.07K | -8.86M | -8.48M | -6.11M | -3.80M | -5.35M | -765.21K | -343.94K | -216.95K | -1.02M | -1.37M | -1.61M | -96.37K | 0.00 |
| Operating Income Ratio | -449.72% | -314.75% | -421.46% | -466.80% | 94.64% | -2,986.19% | -7,054.36% | -278,109.10% | 0.00% | 0.00% | 0.00% | 0.00% | 0.00% | -290.78% | -65.00% | -84.70% | -3.67% | 0.00% |
| Total Other Income/Expenses | -5.90M | -1.64M | -1.59M | -7.48M | 6.84M | -1.94M | -1.21M | -2.01M | -166.94K | -2.65K | -27.35K | 53.06K | -232.49K | -2.16M | -573.54K | -11.34K | 14.60K | 0.00 |
| Income Before Tax | -21.13M | -17.14M | -13.53M | -18.81M | -1.88M | -8.99M | -8.50M | -6.23M | -3.80M | -5.34M | -766.90K | -290.88K | -449.44K | -3.18M | -1.95M | -1.63M | -81.77K | 0.00 |
| Income Before Tax Ratio | -623.80% | -368.81% | -456.71% | -924.70% | -285.93% | -3,029.02% | -7,070.76% | -283,571.37% | 0.00% | 0.00% | 0.00% | 0.00% | 0.00% | -904.30% | -92.17% | -85.30% | -3.11% | 0.00% |
| Income Tax Expense | 2.02K | -1.36M | -27.28K | 1.21M | 27.32K | -1.04K | -1.63M | -1.73M | 0.00 | 0.00 | -25.66K | 0.00 | -117.28K | 2.14M | 728.55K | 251.84K | 2.57M | 0.00 |
| Net Income | -20.82M | -16.77M | -13.97M | -19.36M | -2.31M | -8.25M | -8.14M | -6.16M | -3.80M | -5.34M | -766.90K | -290.88K | 1.94M | -2.63M | -1.95M | -1.88M | -81.77K | 0.00 |
| Net Income Ratio | -614.71% | -360.79% | -471.33% | -951.67% | -351.91% | -2,778.31% | -6,773.31% | -280,252.34% | 0.00% | 0.00% | 0.00% | 0.00% | 0.00% | -748.06% | -92.17% | -98.51% | -3.11% | 0.00% |
| EPS | -7.07 | -6.53 | -7.33 | -14.01 | -1.91 | -7.33 | -8.43 | -10.20 | -13.43 | -33.40 | -11.83 | -11.25 | 156.00 | -326.13 | -244.95 | -236.36 | -11.07 | 0.00 |
| EPS Diluted | -7.07 | -6.53 | -7.33 | -14.01 | -1.91 | -7.33 | -8.43 | -10.20 | -13.43 | -33.37 | -11.83 | -11.25 | 156.00 | -326.13 | -244.95 | -236.36 | -11.07 | 0.00 |
| Weighted Avg Shares Out | 2.95M | 2.57M | 1.91M | 1.38M | 1.21M | 1.13M | 966.34K | 603.56K | 282.81K | 159.81K | 64.81K | 25.86K | 12.40K | 8.07K | 7.94K | 7.94K | 7.39K | 7.39K |
| Weighted Avg Shares Out (Dil) | 2.95M | 2.57M | 1.91M | 1.38M | 1.21M | 1.13M | 966.34K | 603.56K | 282.81K | 159.96K | 64.81K | 25.86K | 12.40K | 8.07K | 7.94K | 7.94K | 7.39K | 7.39K |

MGC Pharmaceuticals appoints new joint company secretary in Nadine Barry

MGC Pharma delivers first major ArtemiC Rescue order to Swiss PharmaCan, achieves record quarter for sales revenues

MGC Pharmaceuticals gains 7% on approval for Phase III trial of CimetrA

MGC Pharmaceuticals higher as it receives approval for Phase III trial of CimetrA
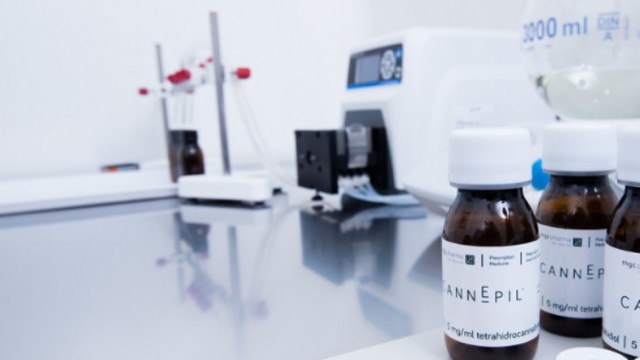
MGC Pharmaceuticals shares higher after director dealing

MGC Pharmaceuticals director shows support for company's ArtemiC product with on-market purchase
MGC Pharmaceuticals says distributor has increased initial order for COVID-19 supplement 85%
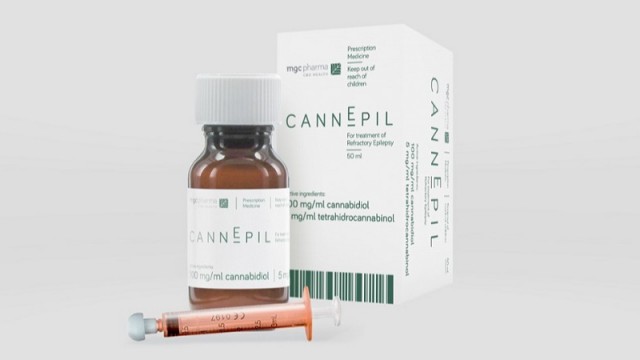
MGC Pharmaceuticals reports strong financial position as it drives medical cannabis growth
Cannabis company MGC Pharmaceuticals soars on food supplement product deal
MGC Pharmaceuticals surges after distribution deal with SwissPharmaCan
Source: https://incomestatements.info
Category: Stock Reports
