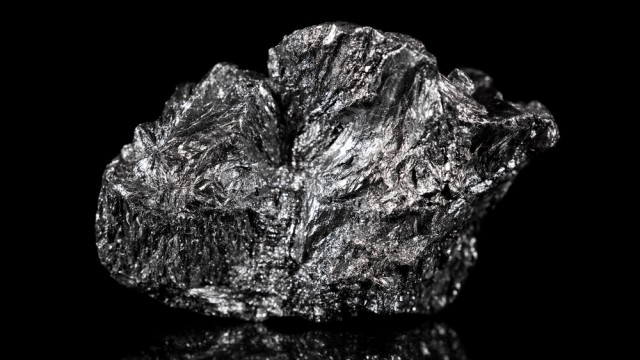
Complete financial analysis of Mason Graphite Inc. (MGPHF) income statement, including revenue, profit margins, EPS and key performance metrics. Get detailed insights into the financial performance of Mason Graphite Inc., a leading company in the Industrial Materials industry within the Basic Materials sector.
- Ouster, Inc. (OUST-WT) Income Statement Analysis – Financial Results
- Bestway Global Holding Inc. (3358.HK) Income Statement Analysis – Financial Results
- Kuk-Il Paper Mfg Co.,Ltd (078130.KQ) Income Statement Analysis – Financial Results
- PT Pool Advista Finance Tbk (POLA.JK) Income Statement Analysis – Financial Results
- Mobiv Acquisition Corp (MOBVU) Income Statement Analysis – Financial Results
Mason Graphite Inc. (MGPHF)
About Mason Graphite Inc.
Mason Graphite Inc., a mining and processing company, engages in the extraction, processing, and development of graphite deposits in Canada. The company primarily owns a 100% interest in the Lac Guéret graphite property, which consists of 74 claims covering an area of 4,000 hectares located in northeastern Quebec. It also focuses on the production and commercialization of patented graphene products for various industrial sectors, including concrete, polymers, Li-ion batteries, and others; and development of value-added graphite products. Mason Graphite Inc. was incorporated in 2011 and is headquartered in Laval, Canada.
| Metric | 2023 | 2022 | 2021 | 2020 | 2019 | 2018 | 2017 | 2016 | 2015 | 2014 | 2013 | 2012 |
|---|---|---|---|---|---|---|---|---|---|---|---|---|
| Revenue | 219.91K | 0.00 | 0.00 | 0.00 | 0.00 | 0.00 | 0.00 | 0.00 | 0.00 | 0.00 | 0.00 | 0.00 |
| Cost of Revenue | 163.41K | 23.09K | 31.22K | 27.47K | 18.06K | 2.70M | 2.03M | 50.00 | 58.33 | 0.00 | 0.00 | 0.00 |
| Gross Profit | 56.50K | -23.09K | -31.22K | -27.47K | -18.06K | -2.70M | -2.03M | -50.00 | -58.33 | 0.00 | 0.00 | 0.00 |
| Gross Profit Ratio | 25.69% | 0.00% | 0.00% | 0.00% | 0.00% | 0.00% | 0.00% | 0.00% | 0.00% | 0.00% | 0.00% | 0.00% |
| Research & Development | 306.34K | 433.47K | 1.64M | 1.92M | 2.26M | 1.23M | 1.53M | 0.00 | 0.00 | 0.00 | 0.00 | 0.00 |
| General & Administrative | 2.74M | 3.78M | 4.67M | 2.24M | 2.22M | 3.00M | 2.78M | 1.85M | 2.68M | 3.77M | 7.31M | 96.40K |
| Selling & Marketing | 0.00 | 119.04 | 98.16 | 2.66 | 25.13 | 45.09 | 15.05 | 53.08 | 90.70K | 465.80K | 175.47 | 0.00 |
| SG&A | 2.74M | 3.99M | 4.87M | 2.45M | 2.66M | 4.99M | 3.61M | 1.85M | 2.68M | 4.24M | 7.31M | 96.40K |
| Other Expenses | 0.00 | -308.47K | -954.07K | -381.20K | 0.00 | 0.00 | 0.00 | 0.00 | 0.00 | 0.00 | 0.00 | 0.00 |
| Operating Expenses | 2.90M | 4.73M | 7.46M | 4.75M | 4.92M | 6.23M | 5.14M | 1.85M | 2.68M | 4.24M | 7.31M | 96.40K |
| Cost & Expenses | 3.06M | 4.76M | 7.50M | 4.77M | 4.94M | 6.23M | 5.14M | 1.85M | 2.68M | 4.24M | 7.31M | 96.40K |
| Interest Income | 265.54K | 73.56K | 161.50K | 428.09K | 504.53K | 430.20K | 121.48K | 20.85K | 108.61K | 59.18K | 27.89K | 2.41K |
| Interest Expense | 0.00 | 0.00 | 0.00 | 0.00 | 773.21K | 788.54K | 1.21M | 1.86M | 299.05K | 39.09K | 0.00 | 0.00 |
| Depreciation & Amortization | 96.68K | 23.09K | 31.22K | 27.47K | 18.06K | 5.70M | 4.73M | 1.79M | 2.62K | 4.18K | 3.35K | 0.00 |
| EBITDA | -2.69M | -4.73M | -7.46M | -4.75M | -4.92M | -4.08M | -5.43M | -2.68M | -2.13M | -4.24M | -7.28M | -96.40K |
| EBITDA Ratio | -1,222.26% | 0.00% | 0.00% | 0.00% | 0.00% | 0.00% | 0.00% | 0.00% | 0.00% | 0.00% | 0.00% | 0.00% |
| Operating Income | -3.51M | -4.76M | -7.50M | -4.77M | -4.94M | -6.23M | -5.14M | -1.85M | -2.68M | -4.24M | -7.31M | -96.40K |
| Operating Income Ratio | -1,596.50% | 0.00% | 0.00% | 0.00% | 0.00% | 0.00% | 0.00% | 0.00% | 0.00% | 0.00% | 0.00% | 0.00% |
| Total Other Income/Expenses | -3.39M | 73.56K | -110.22K | -22.27M | 5.34M | 4.58M | -2.62M | -1.33M | -230.47K | 195.11K | -198.92K | 0.00 |
| Income Before Tax | -6.90M | -4.47M | -6.82M | -26.37M | 2.71M | 269.21K | -7.75M | -3.17M | -2.91M | -4.05M | -7.51M | 0.00 |
| Income Before Tax Ratio | -3,139.27% | 0.00% | 0.00% | 0.00% | 0.00% | 0.00% | 0.00% | 0.00% | 0.00% | 0.00% | 0.00% | 0.00% |
| Income Tax Expense | 1.20M | 1.63M | -271.71K | -292.44K | -53.31K | -102.24K | 199.00K | 310.00K | 740.00K | 1.26M | -3.35K | 93.98K |
| Net Income | -7.23M | -6.10M | -6.55M | -26.45M | 839.91K | -1.12M | -8.71M | -3.94M | -3.65M | -5.31M | -7.51M | -93.98K |
| Net Income Ratio | -3,289.98% | 0.00% | 0.00% | 0.00% | 0.00% | 0.00% | 0.00% | 0.00% | 0.00% | 0.00% | 0.00% | 0.00% |
| EPS | -0.05 | -0.04 | -0.05 | -0.19 | 0.01 | -0.01 | -0.08 | -0.05 | -0.04 | -0.08 | -0.14 | -0.03 |
| EPS Diluted | -0.05 | -0.04 | -0.05 | -0.19 | 0.01 | -0.01 | -0.08 | -0.05 | -0.04 | -0.08 | -0.14 | -0.03 |
| Weighted Avg Shares Out | 140.86M | 136.23M | 136.25M | 136.23M | 136.10M | 124.85M | 107.36M | 86.43M | 85.90M | 70.44M | 53.57M | 2.95M |
| Weighted Avg Shares Out (Dil) | 140.86M | 136.23M | 136.25M | 136.23M | 136.21M | 124.85M | 107.36M | 86.43M | 85.90M | 70.44M | 53.57M | 2.95M |

Graphite Miners News For The Month Of July 2023

Graphite Miners News For The Month Of June 2023

Graphite Miners News For The Month Of May 2023

Mason Graphite reports strategic partnership between Black Swan Graphene and Nationwide Engineering

Mason Graphite's JV partner Nouveau Monde Graphite files PEA for Uatnan mining project in Québec

Graphite Miners News For The Month Of February 2023

Graphite Miners News For The Month Of January 2023

Mason Graphite says preliminary economic assessment of Uatnan Mining project in Quebec showcases one of the largest graphite projects in development

Graphite Miners News For The Month Of December 2022

Mason Graphite to expand board with appointment of Adree DeLazzer
Source: https://incomestatements.info
Category: Stock Reports
