See more : Recruiter.com Group, Inc. (RCRTW) Income Statement Analysis – Financial Results
Complete financial analysis of Mason Graphite Inc. (MGPHF) income statement, including revenue, profit margins, EPS and key performance metrics. Get detailed insights into the financial performance of Mason Graphite Inc., a leading company in the Industrial Materials industry within the Basic Materials sector.
- Raimon Land Public Company Limited (RML.BK) Income Statement Analysis – Financial Results
- Café de Coral Holdings Limited (0341.HK) Income Statement Analysis – Financial Results
- Daegu Department Store Co., Ltd. (006370.KS) Income Statement Analysis – Financial Results
- Cal Bay International, Inc. (CBYI) Income Statement Analysis – Financial Results
- Nordea Invest – Verdens Obligationsmarkeder (NDIVOMKL1.CO) Income Statement Analysis – Financial Results
Mason Graphite Inc. (MGPHF)
About Mason Graphite Inc.
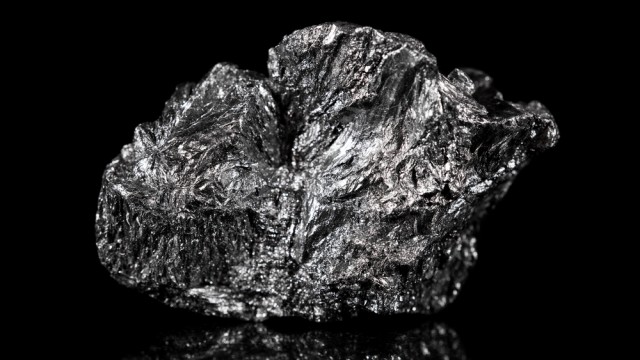
Mason Graphite Inc., a mining and processing company, engages in the extraction, processing, and development of graphite deposits in Canada. The company primarily owns a 100% interest in the Lac Guéret graphite property, which consists of 74 claims covering an area of 4,000 hectares located in northeastern Quebec. It also focuses on the production and commercialization of patented graphene products for various industrial sectors, including concrete, polymers, Li-ion batteries, and others; and development of value-added graphite products. Mason Graphite Inc. was incorporated in 2011 and is headquartered in Laval, Canada.
| Metric | 2023 | 2022 | 2021 | 2020 | 2019 | 2018 | 2017 | 2016 | 2015 | 2014 | 2013 | 2012 |
|---|---|---|---|---|---|---|---|---|---|---|---|---|
| Revenue | 219.91K | 0.00 | 0.00 | 0.00 | 0.00 | 0.00 | 0.00 | 0.00 | 0.00 | 0.00 | 0.00 | 0.00 |
| Cost of Revenue | 163.41K | 23.09K | 31.22K | 27.47K | 18.06K | 2.70M | 2.03M | 50.00 | 58.33 | 0.00 | 0.00 | 0.00 |
| Gross Profit | 56.50K | -23.09K | -31.22K | -27.47K | -18.06K | -2.70M | -2.03M | -50.00 | -58.33 | 0.00 | 0.00 | 0.00 |
| Gross Profit Ratio | 25.69% | 0.00% | 0.00% | 0.00% | 0.00% | 0.00% | 0.00% | 0.00% | 0.00% | 0.00% | 0.00% | 0.00% |
| Research & Development | 306.34K | 433.47K | 1.64M | 1.92M | 2.26M | 1.23M | 1.53M | 0.00 | 0.00 | 0.00 | 0.00 | 0.00 |
| General & Administrative | 2.74M | 3.78M | 4.67M | 2.24M | 2.22M | 3.00M | 2.78M | 1.85M | 2.68M | 3.77M | 7.31M | 96.40K |
| Selling & Marketing | 0.00 | 119.04 | 98.16 | 2.66 | 25.13 | 45.09 | 15.05 | 53.08 | 90.70K | 465.80K | 175.47 | 0.00 |
| SG&A | 2.74M | 3.99M | 4.87M | 2.45M | 2.66M | 4.99M | 3.61M | 1.85M | 2.68M | 4.24M | 7.31M | 96.40K |
| Other Expenses | 0.00 | -308.47K | -954.07K | -381.20K | 0.00 | 0.00 | 0.00 | 0.00 | 0.00 | 0.00 | 0.00 | 0.00 |
| Operating Expenses | 2.90M | 4.73M | 7.46M | 4.75M | 4.92M | 6.23M | 5.14M | 1.85M | 2.68M | 4.24M | 7.31M | 96.40K |
| Cost & Expenses | 3.06M | 4.76M | 7.50M | 4.77M | 4.94M | 6.23M | 5.14M | 1.85M | 2.68M | 4.24M | 7.31M | 96.40K |
| Interest Income | 265.54K | 73.56K | 161.50K | 428.09K | 504.53K | 430.20K | 121.48K | 20.85K | 108.61K | 59.18K | 27.89K | 2.41K |
| Interest Expense | 0.00 | 0.00 | 0.00 | 0.00 | 773.21K | 788.54K | 1.21M | 1.86M | 299.05K | 39.09K | 0.00 | 0.00 |
| Depreciation & Amortization | 96.68K | 23.09K | 31.22K | 27.47K | 18.06K | 5.70M | 4.73M | 1.79M | 2.62K | 4.18K | 3.35K | 0.00 |
| EBITDA | -2.69M | -4.73M | -7.46M | -4.75M | -4.92M | -4.08M | -5.43M | -2.68M | -2.13M | -4.24M | -7.28M | -96.40K |
| EBITDA Ratio | -1,222.26% | 0.00% | 0.00% | 0.00% | 0.00% | 0.00% | 0.00% | 0.00% | 0.00% | 0.00% | 0.00% | 0.00% |
| Operating Income | -3.51M | -4.76M | -7.50M | -4.77M | -4.94M | -6.23M | -5.14M | -1.85M | -2.68M | -4.24M | -7.31M | -96.40K |
| Operating Income Ratio | -1,596.50% | 0.00% | 0.00% | 0.00% | 0.00% | 0.00% | 0.00% | 0.00% | 0.00% | 0.00% | 0.00% | 0.00% |
| Total Other Income/Expenses | -3.39M | 73.56K | -110.22K | -22.27M | 5.34M | 4.58M | -2.62M | -1.33M | -230.47K | 195.11K | -198.92K | 0.00 |
| Income Before Tax | -6.90M | -4.47M | -6.82M | -26.37M | 2.71M | 269.21K | -7.75M | -3.17M | -2.91M | -4.05M | -7.51M | 0.00 |
| Income Before Tax Ratio | -3,139.27% | 0.00% | 0.00% | 0.00% | 0.00% | 0.00% | 0.00% | 0.00% | 0.00% | 0.00% | 0.00% | 0.00% |
| Income Tax Expense | 1.20M | 1.63M | -271.71K | -292.44K | -53.31K | -102.24K | 199.00K | 310.00K | 740.00K | 1.26M | -3.35K | 93.98K |
| Net Income | -7.23M | -6.10M | -6.55M | -26.45M | 839.91K | -1.12M | -8.71M | -3.94M | -3.65M | -5.31M | -7.51M | -93.98K |
| Net Income Ratio | -3,289.98% | 0.00% | 0.00% | 0.00% | 0.00% | 0.00% | 0.00% | 0.00% | 0.00% | 0.00% | 0.00% | 0.00% |
| EPS | -0.05 | -0.04 | -0.05 | -0.19 | 0.01 | -0.01 | -0.08 | -0.05 | -0.04 | -0.08 | -0.14 | -0.03 |
| EPS Diluted | -0.05 | -0.04 | -0.05 | -0.19 | 0.01 | -0.01 | -0.08 | -0.05 | -0.04 | -0.08 | -0.14 | -0.03 |
| Weighted Avg Shares Out | 140.86M | 136.23M | 136.25M | 136.23M | 136.10M | 124.85M | 107.36M | 86.43M | 85.90M | 70.44M | 53.57M | 2.95M |
| Weighted Avg Shares Out (Dil) | 140.86M | 136.23M | 136.25M | 136.23M | 136.21M | 124.85M | 107.36M | 86.43M | 85.90M | 70.44M | 53.57M | 2.95M |

Mason Graphite welcomes Peter Damouni as new CEO

Mason Graphite says its joint venture with Nouveau Monde Graphite has the blessing of independent proxy voting advisors

Mason Graphite says two proxy advisory firms recommend vote in favour of agreement with Nouveau Monde Graphite

Mason Graphite inks joint venture with Nouveau Monde Graphite to develop Lac Guéret property in Quebec

Mason Graphite updates on developments related to partner Black Swan Graphene's intent to go public

Mason Graphite names Carmelo Marelli as CFO

Top 3 Graphite Miners With Value-Add Potential

Mason Graphite congratulates partner Black Swan Graphene on its intent to go public; appoints Paul Hardy as its vice-president corporate development

Mason Graphite helps transform natural graphite into green technologies
Mason Graphite announces ‘highly promising' testing results for silicon-graphite composite anode material
Source: https://incomestatements.info
Category: Stock Reports
