See more : G. G. Dandekar Machine Works Limited (GGDANDE.BO) Income Statement Analysis – Financial Results
Complete financial analysis of BlackRock MuniHoldings Fund, Inc. (MHD) income statement, including revenue, profit margins, EPS and key performance metrics. Get detailed insights into the financial performance of BlackRock MuniHoldings Fund, Inc., a leading company in the Asset Management industry within the Financial Services sector.
- Shougang Century Holdings Limited (0103.HK) Income Statement Analysis – Financial Results
- Shah Alloys Limited (SHAHALLOYS.NS) Income Statement Analysis – Financial Results
- Mrs. Bectors Food Specialities Limited (BECTORFOOD.NS) Income Statement Analysis – Financial Results
- Port Inc. (7047.T) Income Statement Analysis – Financial Results
- Brookfield Asset Management Inc. (BAM-A.TO) Income Statement Analysis – Financial Results
BlackRock MuniHoldings Fund, Inc. (MHD)
Industry: Asset Management
Sector: Financial Services
Website: https://www.blackrock.com/investing/products/240204/blackrock-muniholdings-fund-inc-usd-fund
About BlackRock MuniHoldings Fund, Inc.
BlackRock MuniHoldings Fund, Inc. is a closed-ended fixed income mutual fund launched by BlackRock, Inc. It is managed by BlackRock Advisors, LLC. The fund invests in the fixed income markets of the United States. It primarily invests in investment grade municipal bonds that are exempt from federal income taxes. The fund seeks to invest in securities with a maturity of more than ten years. BlackRock MuniHoldings Fund, Inc. was formed on May 2, 1997 and is domiciled in the United States.
| Metric | 2022 | 2021 | 2020 | 2019 | 2018 | 2017 | 2016 | 2015 | 2014 | 2013 | 2012 | 2010 |
|---|---|---|---|---|---|---|---|---|---|---|---|---|
| Revenue | -11.91M | -122.73M | 55.18M | -8.59M | 14.87M | 7.34M | 18.05M | 17.99M | 18.26M | 18.43M | 19.08M | 0.00 |
| Cost of Revenue | 0.00 | 0.00 | 34.50M | 0.00 | 0.00 | 0.00 | 4.34M | 3.47M | 3.41M | 0.00 | 0.00 | 0.00 |
| Gross Profit | 48.46M | 49.84M | 20.68M | 15.62M | 17.23M | 7.34M | 13.71M | 14.52M | 14.85M | 18.43M | 19.08M | 0.00 |
| Gross Profit Ratio | -406.86% | -40.61% | 37.48% | -181.90% | 115.92% | 100.00% | 75.96% | 80.73% | 81.31% | 100.00% | 100.00% | 0.00% |
| Research & Development | 0.00 | 0.00 | 0.00 | 0.00 | 0.00 | 0.00 | 0.00 | 0.00 | 0.00 | 0.00 | 0.00 | 0.00 |
| General & Administrative | 395.39K | 487.80K | 242.01K | 249.62K | 238.74K | 270.79K | 265.28K | 262.64K | 274.07K | 2.37M | 2.59M | 0.00 |
| Selling & Marketing | 0.00 | 0.00 | 0.00 | 0.00 | 0.00 | 0.00 | 0.00 | 0.00 | 0.00 | 0.00 | 0.00 | 0.00 |
| SG&A | 395.39K | 487.80K | 242.01K | 249.62K | 238.74K | 270.79K | 265.28K | 262.64K | 274.07K | 2.37M | 2.59M | 0.00 |
| Other Expenses | 0.00 | -97.21K | -117.59K | 21.01K | 23.10K | 22.46K | 23.21K | 45.81K | 45.96K | 0.00 | 0.00 | 0.00 |
| Operating Expenses | 431.81K | 390.59K | 124.42K | 270.62K | 261.84K | 293.25K | 288.49K | 308.45K | 320.03K | 19.51M | 11.69M | 0.00 |
| Cost & Expenses | -44.36M | 16.61M | 35.91M | -21.66M | 763.71K | 293.25K | 4.63M | 3.77M | 3.73M | -19.51M | 11.69M | 0.00 |
| Interest Income | 48.03M | 52.16M | 20.68M | 15.52M | 17.19M | 17.62M | 0.00 | 0.00 | 0.00 | 0.00 | 0.00 | |
| Interest Expense | 16.45M | 5.10M | 1.79M | 2.82M | 3.39M | 2.77M | 5.84M | 11.01M | 1.36M | 1.48M | 0.00 | |
| Depreciation & Amortization | -41.75M | -42.59M | -17.34M | -13.31M | -14.92M | 52.52K | -30.47M | 11.68M | 22.03M | -16.07M | -16.49M | 0.00 |
| EBITDA | -70.55M | 5.43M | 35.67M | -24.98M | -3.70M | 9.82M | -17.05M | 25.90M | 36.56M | -19.86M | 11.21M | 0.00 |
| EBITDA Ratio | 592.23% | -4.43% | 64.64% | 290.91% | -24.91% | 133.76% | -94.43% | 143.98% | 200.18% | -107.73% | 58.78% | 0.00% |
| Operating Income | 41.75M | 42.59M | 17.34M | 13.31M | 14.92M | 9.82M | 13.42M | 14.21M | 14.53M | 16.07M | 16.49M | 0.00 |
| Operating Income Ratio | -350.53% | -34.70% | 31.43% | -154.94% | 100.33% | 133.76% | 74.36% | 79.02% | 79.55% | 87.16% | 86.44% | 0.00% |
| Total Other Income/Expenses | -54.10M | 14.65M | 37.46M | -22.16M | -311.29K | -2.77M | -15.24M | 5.84M | 11.01M | -18.50M | 12.80M | 0.00 |
| Income Before Tax | -12.34M | -123.12M | 54.80M | -8.86M | 14.61M | 7.05M | -1.81M | 20.05M | 25.54M | -2.44M | 29.30M | 0.00 |
| Income Before Tax Ratio | 103.63% | 100.32% | 99.32% | 103.15% | 98.24% | 96.01% | -10.04% | 111.50% | 139.87% | -13.22% | 153.55% | 0.00% |
| Income Tax Expense | -70.55M | 185.80M | 35.67M | -24.98M | -3.70M | 0.00 | 0.00 | 0.00 | 0.00 | -19.86M | 11.33M | 0.00 |
| Net Income | -12.34M | -123.12M | 54.80M | -8.86M | 14.61M | 7.05M | -1.81M | 20.05M | 25.54M | -2.44M | 29.18M | 0.00 |
| Net Income Ratio | 103.63% | 100.32% | 99.32% | 103.15% | 98.24% | 96.01% | -10.04% | 111.50% | 139.87% | -13.22% | 152.95% | 0.00% |
| EPS | -0.23 | -2.30 | 2.58 | -0.62 | 1.03 | 0.49 | -0.13 | 1.42 | 1.81 | -0.17 | 2.07 | 0.00 |
| EPS Diluted | -0.23 | -2.30 | 2.58 | -0.62 | 1.03 | 0.49 | -0.13 | 1.42 | 1.81 | -0.17 | 2.07 | 0.00 |
| Weighted Avg Shares Out | 52.78M | 53.36M | 53.36M | 14.21M | 14.18M | 14.19M | 14.17M | 14.14M | 14.13M | 14.13M | 14.12M | 14.00M |
| Weighted Avg Shares Out (Dil) | 52.78M | 53.53M | 53.36M | 14.29M | 14.18M | 14.39M | 14.17M | 14.14M | 14.13M | 14.13M | 14.12M | 14.00M |

YH Weekly Commentary Peak

CEF Report April 2021: A Complete Round Trip

BlackRock Announces Special Distributions Related to the Reorganization of Five Municipal Closed-End Funds

BlackRock Announces Results of Shareholder Vote at Adjourned Joint Special Shareholder Meeting Relating to the Reorganizations of Five Municipal Closed-End Funds

BlackRock Announces Results of Joint Special Shareholder Meeting Relating to the Reorganizations of Five Municipal Closed-End Funds

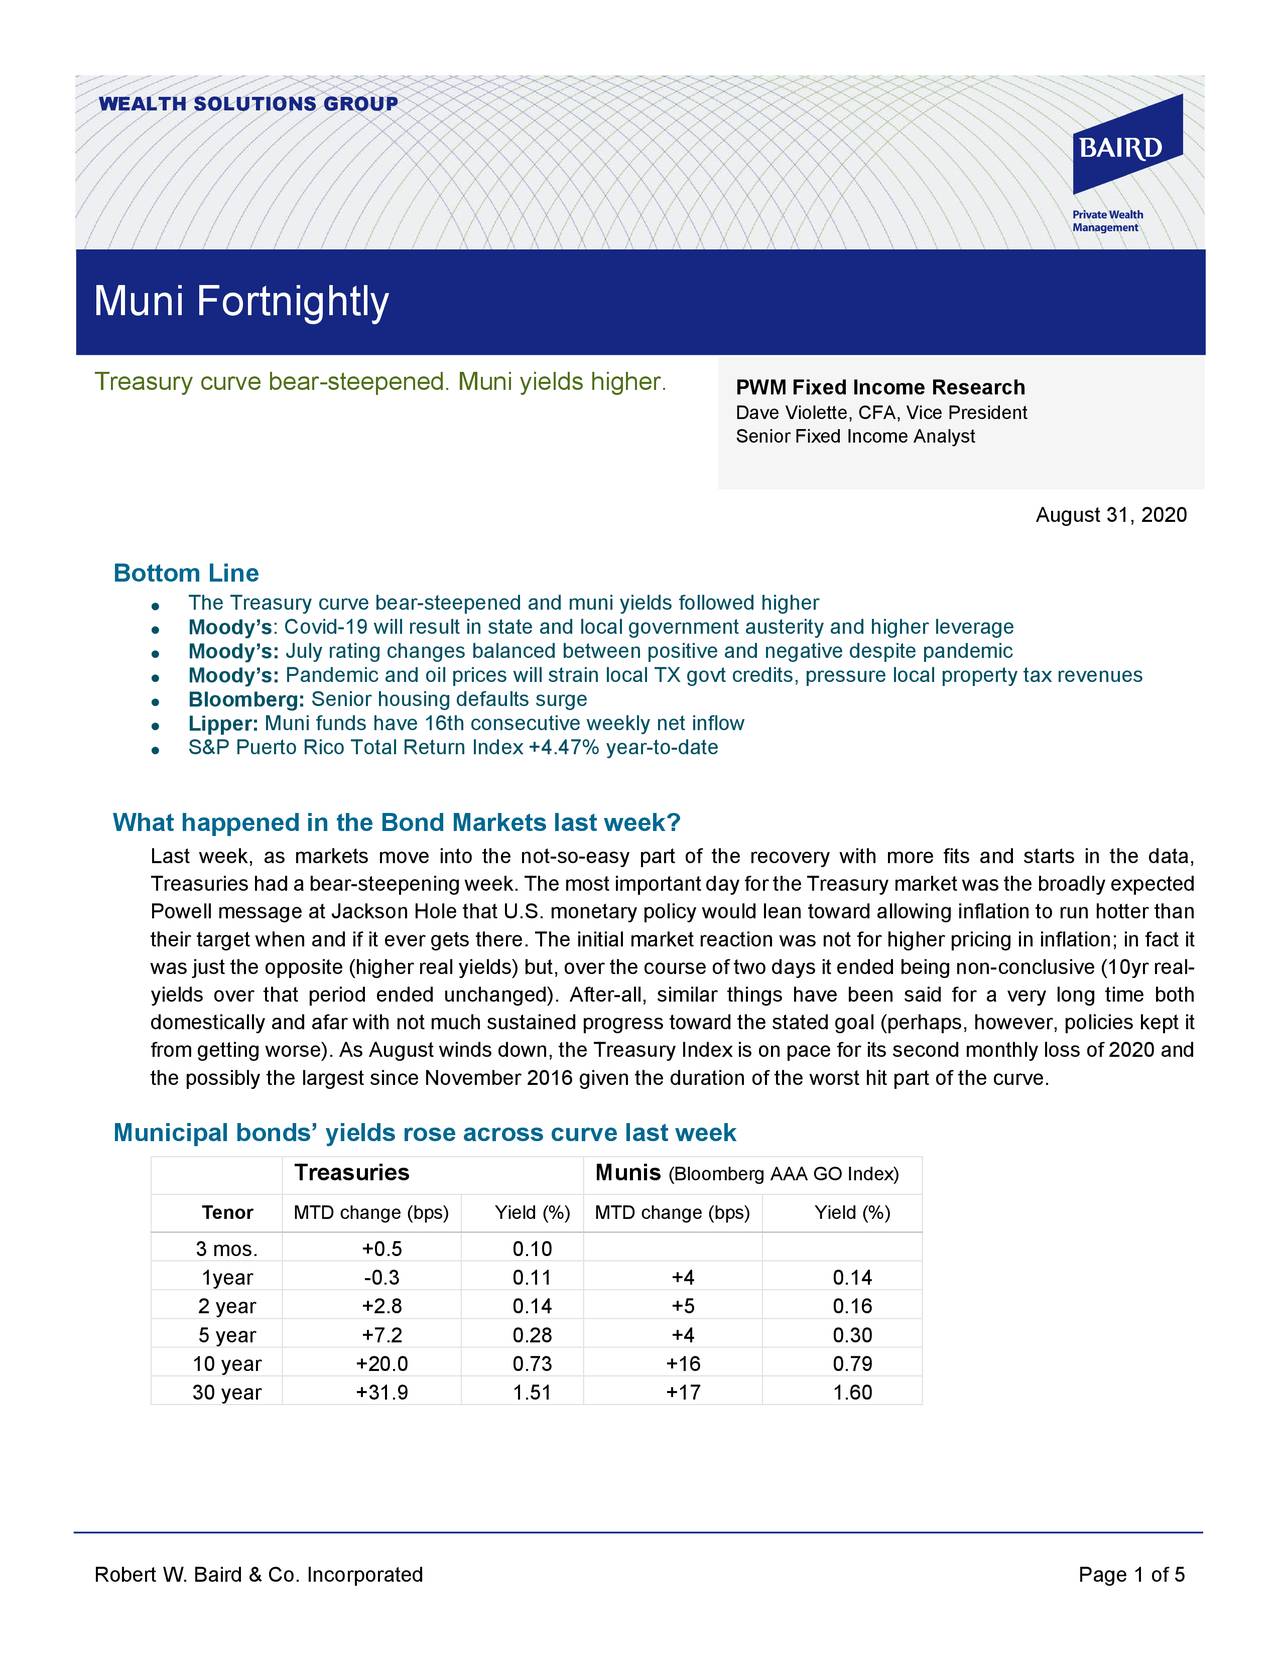
Treasury Curve Bear-Steepened; Muni Yields Higher - Muni Fortnightly, August 31, 2020

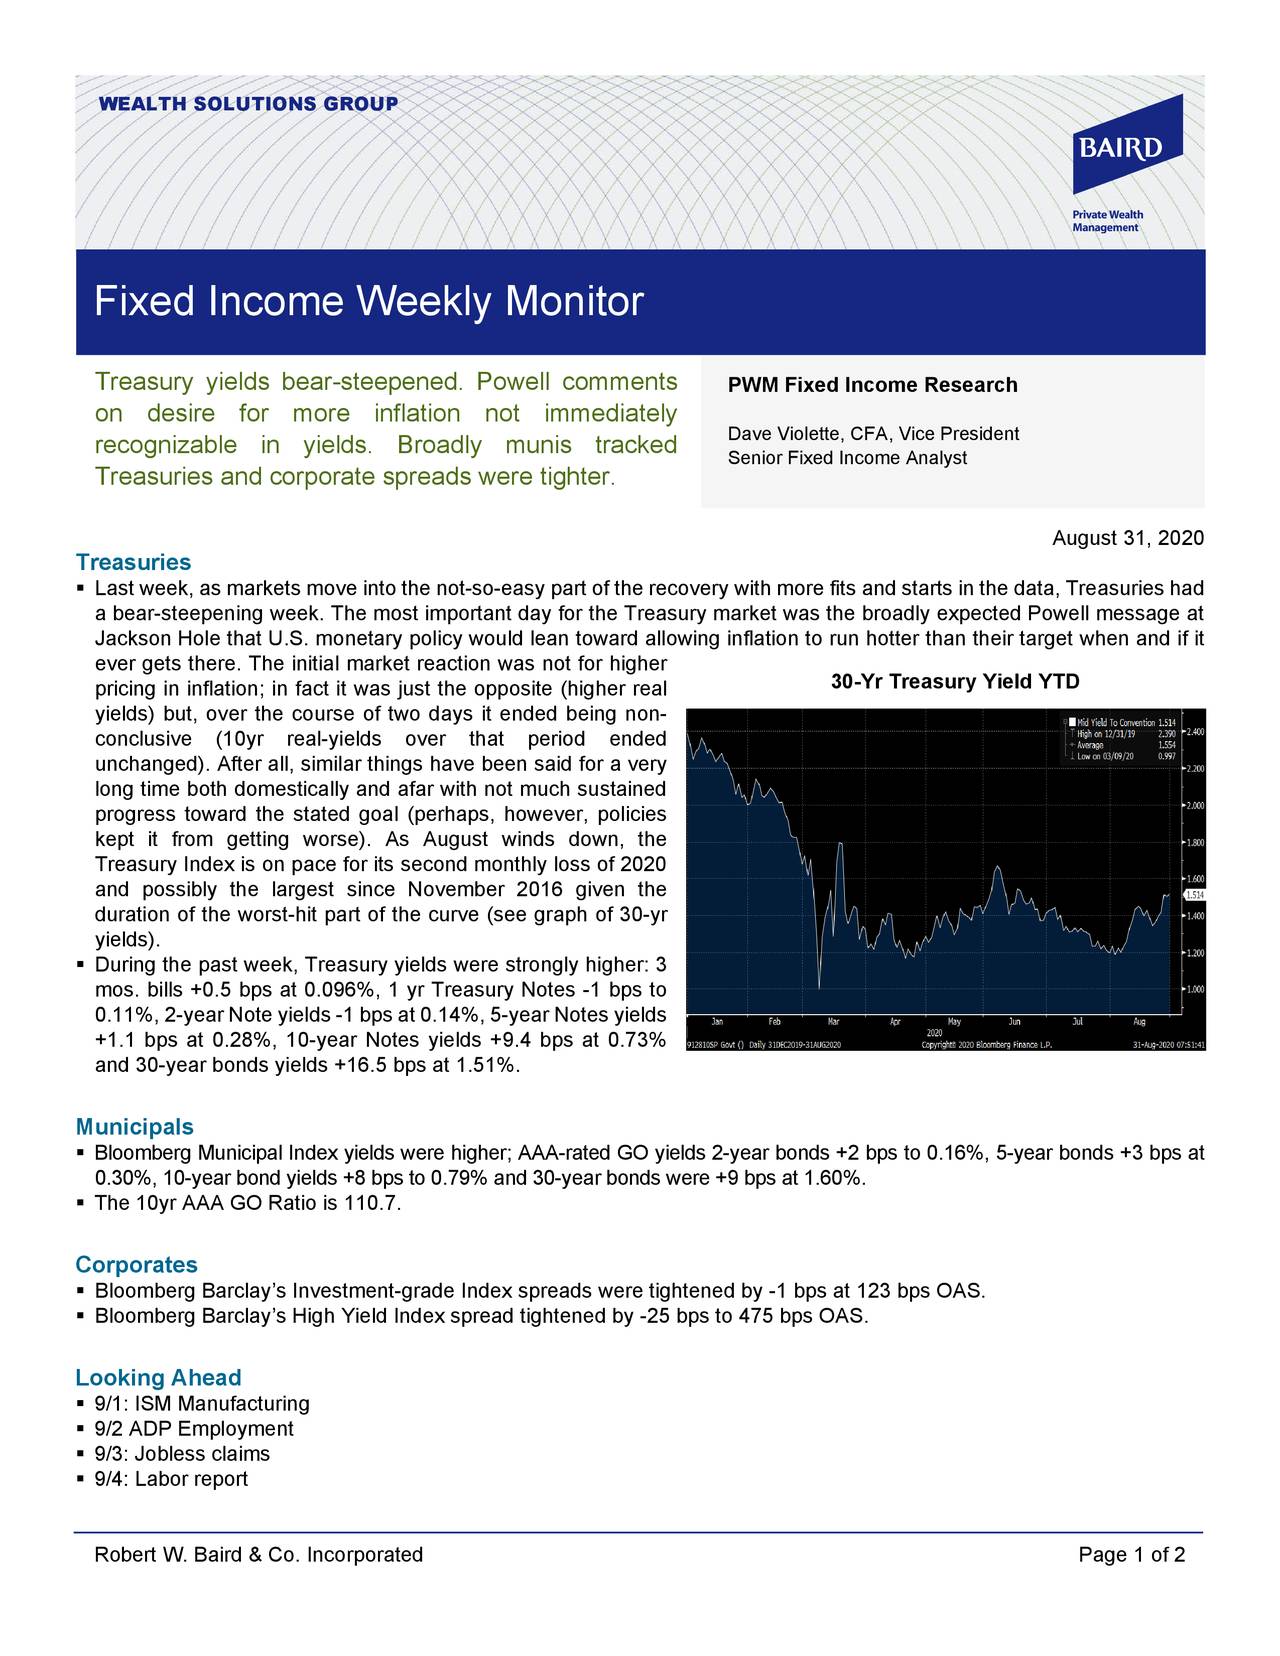
Treasuries Had A Bear-Steepening Week: Fixed Income Weekly Monitor, August 31, 2020

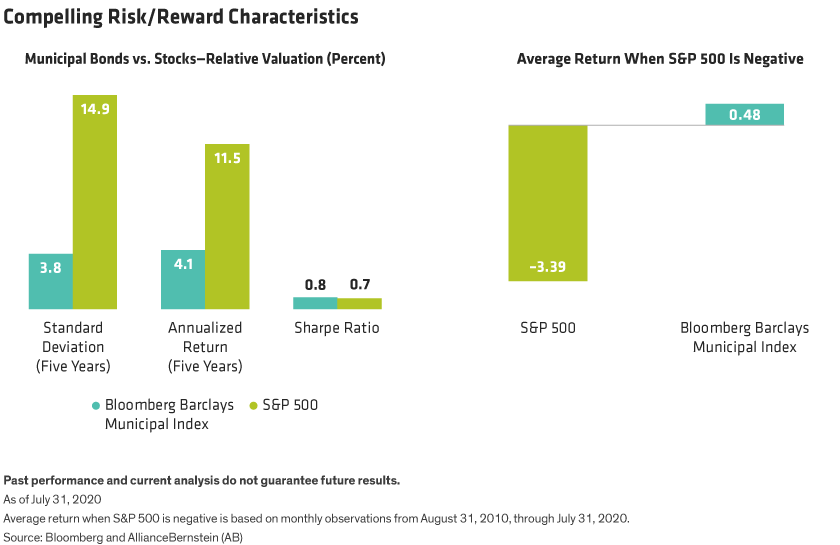
Rule #1 For Bonds: Don't Lose Money

For Muni Investors, COVID-19 Provides Lessons In Liquidity

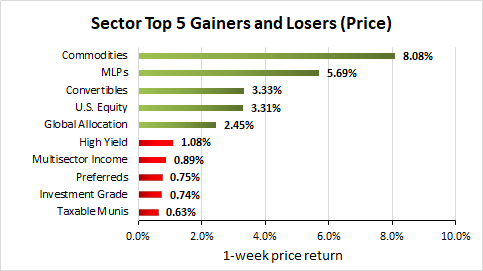
Weekly Closed-End Fund Roundup: August 9, 2020
Source: https://incomestatements.info
Category: Stock Reports
