See more : Banco BMG S.A. (BMGB4.SA) Income Statement Analysis – Financial Results
Complete financial analysis of Miller Industries, Inc. (MLR) income statement, including revenue, profit margins, EPS and key performance metrics. Get detailed insights into the financial performance of Miller Industries, Inc., a leading company in the Auto – Parts industry within the Consumer Cyclical sector.
- PacifiCorp (PPWLM) Income Statement Analysis – Financial Results
- JSC Halyk Bank (HSBK.L) Income Statement Analysis – Financial Results
- PT Mitra Investindo Tbk (MITI.JK) Income Statement Analysis – Financial Results
- Yue Yuen Industrial (Holdings) Limited (0551.HK) Income Statement Analysis – Financial Results
- NextGen Acquisition Corp. II (NGCAU) Income Statement Analysis – Financial Results
Miller Industries, Inc. (MLR)
About Miller Industries, Inc.
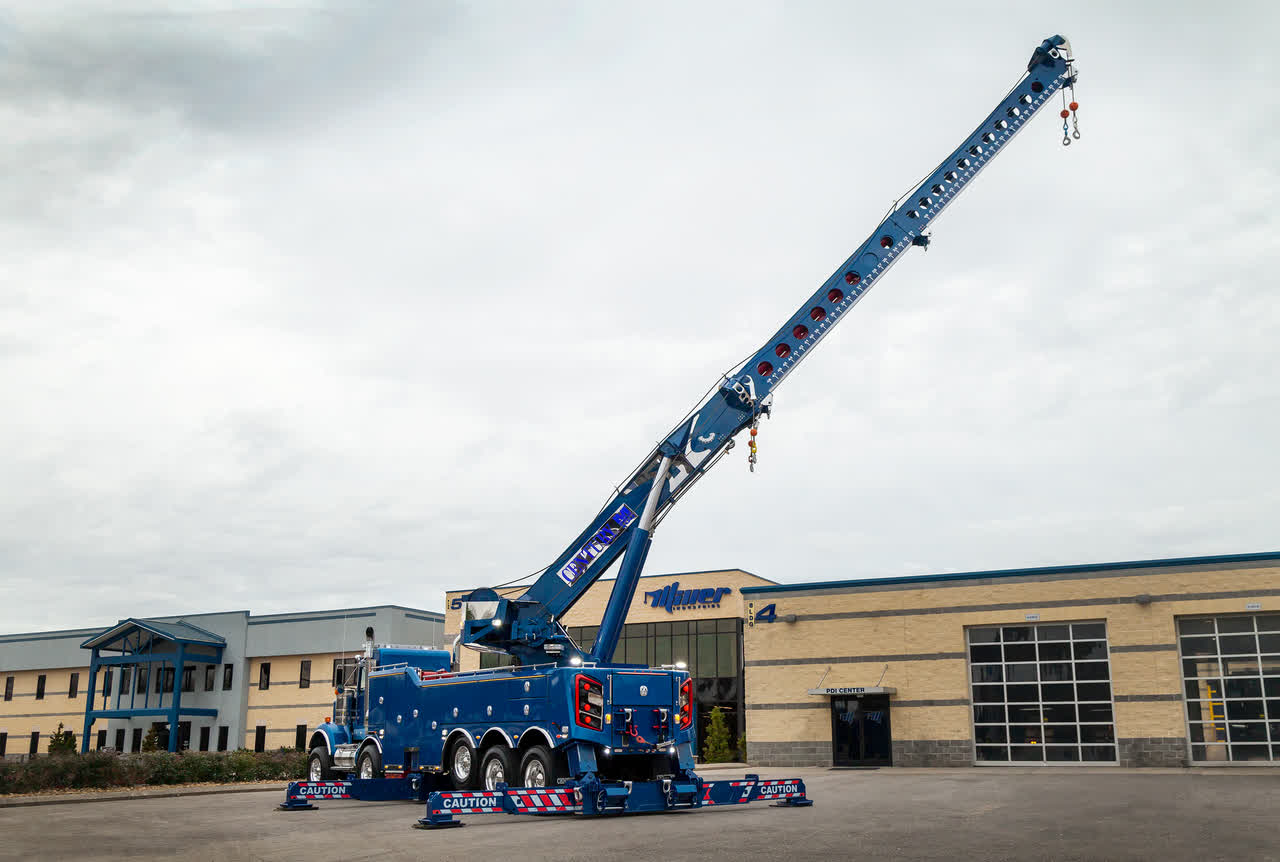
Miller Industries, Inc., together with its subsidiaries, manufactures and sells towing and recovery equipment. The company offers wreckers that are used to recover and tow disabled vehicles and other equipment; and car carriers, which are specialized flatbed vehicles with hydraulic tilt mechanisms, which are used to transport new or disabled vehicles and other equipment. It also provides transport trailers for moving various vehicles for auto auctions, car dealerships, leasing companies, and other related applications. The company markets its products under the Century, Challenger, Holmes, Champion, Eagle, Titan, Jige, Boniface, Vulcan, and Chevron brands. Miller Industries, Inc. sells its products through independent distributors in the United States, Canada, Mexico, Europe, the Pacific Rim, the Middle East, South America, and Africa; and through prime contractors to governmental entities. The company was incorporated in 1990 and is based in Ooltewah, Tennessee.
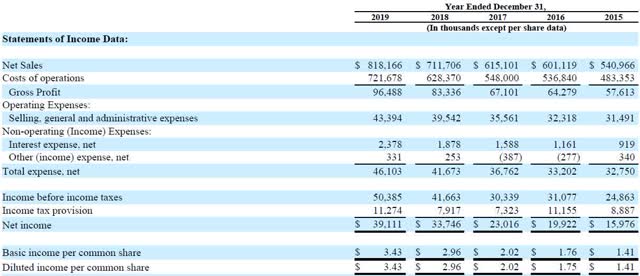
| Metric | 2023 | 2022 | 2021 | 2020 | 2019 | 2018 | 2017 | 2016 | 2015 | 2014 | 2013 | 2012 | 2011 | 2010 | 2009 | 2008 | 2007 | 2006 | 2005 | 2004 | 2003 | 2002 | 2001 | 2000 | 1999 | 1998 | 1997 | 1996 | 1995 |
|---|---|---|---|---|---|---|---|---|---|---|---|---|---|---|---|---|---|---|---|---|---|---|---|---|---|---|---|---|---|
| Revenue | 1.15B | 848.46M | 717.48M | 651.29M | 818.17M | 711.71M | 615.10M | 601.12M | 540.97M | 492.78M | 404.17M | 342.66M | 412.66M | 306.90M | 237.57M | 270.99M | 400.03M | 409.42M | 351.88M | 236.31M | 206.00M | 203.06M | 495.46M | 581.49M | 525.90M | 397.20M | 292.40M | 125.70M | 94.70M |
| Cost of Revenue | 1.00B | 766.04M | 647.62M | 572.93M | 721.68M | 628.37M | 548.00M | 536.84M | 483.35M | 439.79M | 361.73M | 302.61M | 342.56M | 260.57M | 202.27M | 237.36M | 343.89M | 349.64M | 301.94M | 205.02M | 179.01M | 174.52M | 0.00 | 472.19M | 420.20M | 309.30M | 232.80M | 103.90M | 78.00M |
| Gross Profit | 151.85M | 82.42M | 69.85M | 78.36M | 96.49M | 83.34M | 67.10M | 64.28M | 57.61M | 52.99M | 42.44M | 40.06M | 70.10M | 46.33M | 35.30M | 33.63M | 56.15M | 59.78M | 49.94M | 31.29M | 26.99M | 28.54M | 495.46M | 109.30M | 105.70M | 87.90M | 59.60M | 21.80M | 16.70M |
| Gross Profit Ratio | 13.17% | 9.71% | 9.74% | 12.03% | 11.79% | 11.71% | 10.91% | 10.69% | 10.65% | 10.75% | 10.50% | 11.69% | 16.99% | 15.10% | 14.86% | 12.41% | 14.04% | 14.60% | 14.19% | 13.24% | 13.10% | 14.06% | 100.00% | 18.80% | 20.10% | 22.13% | 20.38% | 17.34% | 17.63% |
| Research & Development | 0.00 | 4.03M | 3.56M | 4.72M | 3.70M | 3.13M | 1.94M | 1.80M | 1.60M | 1.90M | 1.30M | 1.44M | 0.00 | 0.00 | 0.00 | 0.00 | 0.00 | 0.00 | 0.00 | 0.00 | 0.00 | 0.00 | 0.00 | 0.00 | 0.00 | 0.00 | 0.00 | 0.00 | 0.00 |
| General & Administrative | 1.18M | 943.00K | 200.00K | 0.00 | 0.00 | 0.00 | 0.00 | 0.00 | 0.00 | 0.00 | 0.00 | 0.00 | 0.00 | 0.00 | 0.00 | 0.00 | 0.00 | 0.00 | 0.00 | 0.00 | 0.00 | 0.00 | 0.00 | 0.00 | 0.00 | 0.00 | 0.00 | 0.00 | 0.00 |
| Selling & Marketing | 71.91M | 51.88M | 46.03M | 0.00 | 0.00 | 0.00 | 0.00 | 0.00 | 0.00 | 0.00 | 0.00 | 0.00 | 0.00 | 0.00 | 0.00 | 0.00 | 0.00 | 0.00 | 0.00 | 0.00 | 0.00 | 0.00 | 0.00 | 0.00 | 0.00 | 0.00 | 0.00 | 0.00 | 0.00 |
| SG&A | 73.09M | 52.83M | 46.23M | 39.71M | 43.39M | 39.54M | 35.56M | 32.32M | 31.49M | 28.50M | 28.32M | 27.51M | 31.41M | 26.67M | 24.91M | 25.94M | 27.11M | 26.84M | 24.29M | 18.90M | 17.41M | 17.43M | 65.39M | 82.63M | 75.40M | 49.40M | 30.20M | 8.70M | 7.60M |
| Other Expenses | 0.00 | -481.00K | -498.00K | 668.00K | -331.00K | -253.00K | 387.00K | 277.00K | -340.00K | -437.00K | -119.00K | -815.00K | -161.00K | 0.00 | -442.00K | 0.00 | 3.52M | 16.91M | 4.66M | 4.66M | 0.00 | 0.00 | 0.00 | 17.79M | 15.50M | 10.20M | 5.80M | 900.00K | 500.00K |
| Operating Expenses | 73.09M | 52.83M | 46.23M | 39.71M | 43.39M | 39.54M | 35.56M | 32.32M | 31.49M | 28.50M | 28.20M | 26.69M | 31.25M | 26.67M | 24.46M | 25.94M | 27.11M | 26.84M | 24.29M | 18.90M | 17.41M | 17.43M | 65.39M | 100.42M | 90.90M | 59.60M | 36.00M | 9.60M | 8.10M |
| Cost & Expenses | 1.07B | 818.86M | 693.86M | 612.64M | 765.07M | 667.91M | 583.56M | 569.16M | 514.84M | 468.29M | 389.94M | 329.30M | 373.80M | 287.23M | 226.74M | 263.30M | 370.99M | 376.48M | 326.24M | 223.93M | 196.42M | 191.95M | 505.07M | 572.62M | 511.10M | 368.90M | 268.80M | 113.50M | 86.10M |
| Interest Income | 0.00 | 3.38M | 1.36M | 1.22M | 2.38M | 0.00 | 0.00 | 0.00 | 0.00 | 0.00 | 0.00 | 0.00 | 0.00 | 0.00 | 0.00 | 0.00 | 0.00 | 0.00 | 0.00 | 0.00 | -1.24M | -249.00K | 0.00 | 0.00 | -1.60M | 0.00 | 0.00 | 0.00 | 0.00 |
| Interest Expense | 5.97M | 3.38M | 1.36M | 1.22M | 2.38M | 1.88M | 1.59M | 1.16M | 919.00K | 554.00K | 369.00K | 712.00K | 728.00K | 305.00K | 883.00K | 1.24M | 3.39M | 3.52M | 4.01M | 4.66M | 21.83M | 53.59M | 16.73M | 12.43M | 10.40M | 3.40M | 600.00K | 600.00K | 0.00 |
| Depreciation & Amortization | 13.24M | 11.76M | 11.04M | 9.60M | 9.13M | 7.75M | 6.15M | 4.83M | 4.32M | 4.02M | 3.76M | 3.81M | 3.68M | 3.53M | 3.48M | 3.52M | 3.26M | 2.84M | 3.24M | 4.03M | 8.07M | 6.55M | 0.00 | 17.79M | 15.50M | 10.20M | 5.80M | 900.00K | 500.00K |
| EBITDA | 93.00M | 41.35M | 34.66M | 48.24M | 62.22M | 51.54M | 37.69M | 36.79M | 30.44M | 28.50M | 18.00M | 17.17M | 42.53M | 23.13M | 14.31M | 11.88M | 32.18M | 35.67M | 28.55M | 15.62M | 17.64M | 17.66M | -9.61M | 20.68M | 25.97M | 30.30M | 29.40M | 29.40M | 9.10M |
| EBITDA Ratio | 8.06% | 3.43% | 3.22% | 6.04% | 6.45% | 6.12% | 5.19% | 5.36% | 4.77% | 4.88% | 3.52% | 5.01% | 10.31% | 7.56% | 6.02% | 4.38% | 8.07% | 8.74% | 8.21% | 6.95% | 8.23% | 8.70% | -1.94% | 18.84% | 5.76% | 10.73% | 10.05% | 10.26% | 9.61% |
| Operating Income | 78.77M | 17.35M | 12.09M | 29.71M | 43.64M | 43.54M | 31.54M | 31.08M | 24.86M | 23.50M | 13.86M | 12.65M | 38.86M | 19.67M | 10.83M | 7.69M | 29.04M | 32.95M | 25.65M | 12.38M | 10.26M | 11.11M | -9.61M | 8.87M | 14.80M | 28.30M | 23.60M | 12.20M | 8.60M |
| Operating Income Ratio | 6.83% | 2.04% | 1.68% | 4.56% | 5.33% | 6.12% | 5.13% | 5.17% | 4.60% | 4.77% | 3.43% | 3.69% | 9.42% | 6.41% | 4.56% | 2.84% | 7.26% | 8.05% | 7.29% | 5.24% | 4.98% | 5.47% | -1.94% | 1.53% | 2.81% | 7.12% | 8.07% | 9.71% | 9.08% |
| Total Other Income/Expenses | -4.98M | 140.00K | 1.75M | 4.17M | -2.71M | -2.13M | -1.20M | 0.00 | 0.00 | 0.00 | 0.00 | 0.00 | -728.00K | -305.00K | -441.00K | -1.92M | -3.39M | -3.52M | -4.01M | -4.66M | -6.29M | -4.37M | 0.00 | -16.73M | -14.03M | -10.30M | -7.40M | 200.00K | 3.80M |
| Income Before Tax | 73.78M | 25.73M | 21.77M | 38.10M | 50.39M | 41.66M | 30.34M | 31.08M | 24.86M | 23.50M | 13.86M | 12.65M | 38.13M | 19.29M | 9.95M | 5.77M | 25.65M | 29.43M | 21.64M | 7.73M | 3.29M | 6.74M | -9.61M | -86.45M | 4.50M | 20.90M | 22.90M | 12.40M | 8.70M |
| Income Before Tax Ratio | 6.40% | 3.03% | 3.03% | 5.85% | 6.16% | 5.85% | 4.93% | 5.17% | 4.60% | 4.77% | 3.43% | 3.69% | 9.24% | 6.29% | 4.19% | 2.13% | 6.41% | 7.19% | 6.15% | 3.27% | 1.60% | 3.32% | -1.94% | -14.87% | 0.86% | 5.26% | 7.83% | 9.86% | 9.19% |
| Income Tax Expense | 15.49M | 5.39M | 5.51M | 8.27M | 11.27M | 7.92M | 7.32M | 11.16M | 8.89M | 8.66M | 5.18M | 3.53M | 15.12M | 7.58M | 3.93M | 2.18M | 9.32M | 2.45M | 2.94M | 740.00K | 1.22M | 3.22M | -3.17M | -13.31M | 2.30M | 8.20M | 8.40M | 4.60M | 3.30M |
| Net Income | 58.29M | 20.35M | 16.26M | 29.83M | 39.11M | 33.75M | 23.02M | 19.92M | 15.98M | 14.90M | 9.23M | 9.12M | 23.01M | 11.71M | 6.02M | 3.59M | 16.33M | 45.34M | 18.59M | 5.48M | -14.15M | -45.69M | -6.43M | -73.14M | 2.20M | 12.70M | 14.50M | 7.80M | 5.70M |
| Net Income Ratio | 5.05% | 2.40% | 2.27% | 4.58% | 4.78% | 4.74% | 3.74% | 3.31% | 2.95% | 3.02% | 2.28% | 2.66% | 5.58% | 3.81% | 2.53% | 1.32% | 4.08% | 11.07% | 5.28% | 2.32% | -6.87% | -22.50% | -1.30% | -12.58% | 0.42% | 3.20% | 4.96% | 6.21% | 6.02% |
| EPS | 5.10 | 1.78 | 1.42 | 2.62 | 3.43 | 2.96 | 2.02 | 1.76 | 1.41 | 1.32 | 0.82 | 0.82 | 1.98 | 1.00 | 0.52 | 0.31 | 1.41 | 3.99 | 1.66 | 0.50 | -1.51 | -4.89 | -0.69 | -7.83 | 0.24 | 1.40 | 1.85 | 1.24 | 1.10 |
| EPS Diluted | 5.07 | 1.78 | 1.42 | 2.62 | 3.43 | 2.96 | 2.02 | 1.75 | 1.41 | 1.31 | 0.82 | 0.82 | 1.92 | 0.96 | 0.51 | 0.31 | 1.40 | 3.91 | 1.62 | 0.50 | -1.51 | -4.89 | -0.69 | -7.83 | 0.23 | 1.35 | 1.75 | 1.24 | 1.10 |
| Weighted Avg Shares Out | 11.44M | 11.42M | 11.41M | 11.41M | 11.40M | 11.39M | 11.37M | 11.35M | 11.32M | 11.30M | 11.23M | 11.07M | 11.60M | 11.67M | 11.61M | 11.59M | 11.56M | 11.36M | 11.23M | 10.86M | 9.34M | 9.34M | 9.34M | 9.34M | 9.27M | 9.07M | 7.84M | 6.30M | 5.18M |
| Weighted Avg Shares Out (Dil) | 11.51M | 11.42M | 11.41M | 11.41M | 11.40M | 11.39M | 11.39M | 11.37M | 11.36M | 11.35M | 11.32M | 11.26M | 11.98M | 12.16M | 11.90M | 11.66M | 11.66M | 11.60M | 11.47M | 10.98M | 9.39M | 9.35M | 9.34M | 9.34M | 9.46M | 9.41M | 8.29M | 6.30M | 5.18M |

iShares Micro-Cap ETF Witnessing Extreme Speculation

The 2021 Market Outlook And Some New Stock Picks - Ryan Detrick And Eddy Elfenbein Join Alpha Trader (Podcast Transcript)

The 2021 Market Outlook And Some New Stock Picks - Ryan Detrick And Eddy Elfenbein Join Alpha Trader

Miller Industries: Market Leader With 60% Upside, 12.4x P/E Is A Large Discount To The Market

Miller Industries: Balance Sheet Trends Point To A Rising Share Price

Miller Industries: New Growth Hidden Under Tow Trucks

Perritt Capital Management Manager Commentary Q2 2020

Miller Industries, Inc. (NYSE:MLR) Stake Cut by Two Sigma Advisers LP

Miller Industries: Solid Business, Overlooked Stock

Wellington Management Group LLP Sells 22,289 Shares of Miller Industries, Inc. (NYSE:MLR)
Source: https://incomestatements.info
Category: Stock Reports
