See more : Hubei Heyuan Gas Co.,Ltd. (002971.SZ) Income Statement Analysis – Financial Results
Complete financial analysis of BlackRock MuniVest Fund, Inc. (MVF) income statement, including revenue, profit margins, EPS and key performance metrics. Get detailed insights into the financial performance of BlackRock MuniVest Fund, Inc., a leading company in the Asset Management industry within the Financial Services sector.
- PT Communication Cable Systems Indonesia Tbk (CCSI.JK) Income Statement Analysis – Financial Results
- Forbes Energy Services Ltd. (FLSS) Income Statement Analysis – Financial Results
- BT Brands, Inc. (BTBD) Income Statement Analysis – Financial Results
- Compass Gold Corporation (COGDF) Income Statement Analysis – Financial Results
- Ko Yo Chemical (Group) Limited (0827.HK) Income Statement Analysis – Financial Results
BlackRock MuniVest Fund, Inc. (MVF)
Industry: Asset Management
Sector: Financial Services
Website: https://www.blackrock.com/investing/products/240201/blackrock-munivest-fund-inc-usd-fund
About BlackRock MuniVest Fund, Inc.
BlackRock MuniVest Fund, Inc. is a closed-ended fixed income mutual fund launched by BlackRock, Inc. It is managed by BlackRock Advisors, LLC. The fund invests in the fixed income markets of the United States. It primarily invests in investment grade, long term municipal obligations that are exempt from federal income taxes. The fund seeks to invest in securities with maturities of more than ten years. BlackRock MuniVest Fund, Inc. was formed on September 29, 1988 and is domiciled in the United States.
| Metric | 2024 | 2023 | 2022 | 2021 | 2020 | 2019 | 2018 | 2017 | 2016 | 2015 | 2014 | 2013 | 2012 | 2011 | 2010 |
|---|---|---|---|---|---|---|---|---|---|---|---|---|---|---|---|
| Revenue | 33.03M | 3.75M | 25.86M | 57.52M | 12.16M | 62.21M | 8.43M | -2.85M | 62.68M | 27.09M | 116.28M | -52.65M | 117.71M | 17.51M | 107.00M |
| Cost of Revenue | 0.00 | 4.15M | 4.94M | 5.20M | 5.08M | 5.01M | 5.24M | 5.44M | 5.59M | 0.00 | 0.00 | 0.00 | 0.00 | 0.00 | 0.00 |
| Gross Profit | 33.03M | -394.42K | 20.92M | 52.32M | 7.08M | 57.20M | 3.19M | -8.29M | 57.10M | 27.09M | 116.28M | -52.65M | 117.71M | 17.51M | 107.00M |
| Gross Profit Ratio | 100.00% | -10.51% | 80.88% | 90.96% | 58.24% | 91.94% | 37.83% | 290.76% | 91.09% | 100.00% | 100.00% | 100.00% | 100.00% | 100.00% | 100.00% |
| Research & Development | 0.00 | -3.40 | -3.69 | 1.52 | 0.38 | 1.63 | 0.16 | -0.07 | 1.23 | 0.00 | 0.00 | 0.00 | 0.00 | 0.00 | 0.00 |
| General & Administrative | 3.78M | 341.72K | 5.14M | 399.08K | 390.85K | 434.45K | 450.78K | 525.76K | 507.89K | 521.93K | 515.22K | 449.24K | 844.39K | 990.82K | 1.05M |
| Selling & Marketing | 0.00 | 0.00 | 0.00 | 0.00 | 0.00 | 0.00 | 0.00 | 0.00 | 0.00 | 0.00 | 0.00 | 0.00 | 0.00 | 0.00 | 0.00 |
| SG&A | 3.78M | 341.72K | -3.69 | 399.08K | 390.85K | 434.45K | 450.78K | 525.76K | 507.89K | 521.93K | 515.22K | 449.24K | 844.39K | 990.82K | 1.05M |
| Other Expenses | 0.00 | -1.20M | 64.84M | 47.41K | 47.36K | 43.59K | 48.88K | 51.36K | 55.22K | 59.04K | 56.81K | 56.06K | 73.75K | 87.60K | 83.41K |
| Operating Expenses | 3.78M | 1.20M | 125.34M | 446.50K | 438.21K | 478.04K | 499.66K | 577.12K | 563.11K | 580.97K | 572.03K | 505.30K | 918.14K | 1.08M | 1.13M |
| Cost & Expenses | 3.78M | 5.35M | 20.92M | 446.50K | 438.21K | 478.04K | 499.66K | 577.12K | 563.11K | 580.97K | 572.03K | 505.30K | 918.14K | 1.08M | 1.13M |
| Interest Income | 32.13M | 31.22M | 4.23M | 35.33M | 38.47M | 42.49M | 46.24M | 47.99M | 49.14M | 48.84M | 49.87M | 53.17M | 53.34M | 53.57M | 52.68M |
| Interest Expense | 11.24M | 11.15M | 4.23M | 3.20M | 5.67M | 8.62M | 7.84M | 6.40M | 4.32M | 3.54M | 3.62M | 4.24M | 3.41M | 1.36M | 1.13M |
| Depreciation & Amortization | -29.24M | -28.14M | -29.10M | -29.94M | -33.28M | -37.34M | -40.84M | -42.32M | -43.31M | -43.03M | 3.62M | 126.16K | 70.33K | 1.36M | 1.13M |
| EBITDA | 0.00 | -1.60M | -91.09M | 0.00 | 0.00 | 0.00 | 0.00 | 2.97M | 0.00 | 0.00 | -67.86M | 0.00 | 0.00 | 0.00 | 0.00 |
| EBITDA Ratio | 0.00% | -42.56% | 452.25% | 99.22% | 96.40% | 99.23% | 187.12% | -104.09% | 105.99% | 110.93% | 102.62% | 92.66% | 102.17% | 101.63% | 100.00% |
| Operating Income | 29.24M | -1.60M | 29.10M | 57.07M | 11.72M | 61.73M | 15.77M | 2.97M | 66.44M | 30.05M | 115.71M | -53.16M | 116.79M | 16.43M | 105.87M |
| Operating Income Ratio | 88.55% | -42.56% | 112.55% | 99.22% | 96.40% | 99.23% | 187.12% | -104.09% | 105.99% | 110.93% | 99.51% | 100.96% | 99.22% | 93.84% | 98.94% |
| Total Other Income/Expenses | 960.00 | -40.89M | -124.43M | 0.00 | -21.56M | 0.00 | -32.91M | -45.75M | 18.81M | -16.52M | 71.48M | -100.28M | 0.00 | 0.00 | 0.00 |
| Income Before Tax | 29.25M | -12.74M | -95.32M | 57.07M | 11.72M | 61.73M | 7.93M | -3.43M | 62.12M | 26.51M | 115.71M | -53.16M | 116.79M | 16.43M | 105.87M |
| Income Before Tax Ratio | 88.55% | -339.60% | -368.61% | 99.22% | 96.40% | 99.23% | 94.07% | 120.23% | 99.10% | 97.86% | 99.51% | 100.96% | 99.22% | 93.84% | 98.94% |
| Income Tax Expense | 0.00 | 28.14M | -91.09M | 26.74M | 27.61M | 28.72M | -161.14K | 42.32M | 43.31M | 43.03M | 71.48M | 4.24M | 3.41M | 0.00 | 0.00 |
| Net Income | 29.25M | -12.74M | -91.09M | 57.07M | 11.72M | 61.73M | 7.93M | -3.43M | 62.12M | 26.51M | 115.71M | -53.16M | 116.79M | 16.43M | 105.87M |
| Net Income Ratio | 88.55% | -339.60% | -352.25% | 99.22% | 96.40% | 99.23% | 94.07% | 120.23% | 99.10% | 97.86% | 99.51% | 100.96% | 99.22% | 93.84% | 98.94% |
| EPS | 0.46 | -0.20 | 0.96 | 0.88 | 0.18 | 0.95 | 0.12 | -0.06 | 0.97 | 0.41 | 1.81 | -0.83 | 0.71 | 0.24 | 1.68 |
| EPS Diluted | 0.46 | -0.20 | 67.59M | 0.88 | 0.18 | 0.95 | 0.12 | -0.06 | 0.97 | 0.41 | 1.81 | -0.83 | 0.71 | 0.24 | 1.68 |
| Weighted Avg Shares Out | 63.45M | 64.05M | -95.32M | 64.84M | 64.84M | 64.84M | 64.84M | 57.16M | 64.04M | 64.04M | 63.93M | 63.98M | 63.62M | 63.08M | 62.46M |
| Weighted Avg Shares Out (Dil) | 63.45M | 64.05M | -1.35 | 64.84M | 64.84M | 64.84M | 66.09M | 57.16M | 64.04M | 64.65M | 63.93M | 64.04M | 63.62M | 63.08M | 62.46M |

Heroes And Villains

Advisor Group Holdings Inc. Buys New Position in BlackRock MuniVest Fund Inc. (NYSEAMERICAN:MVF)
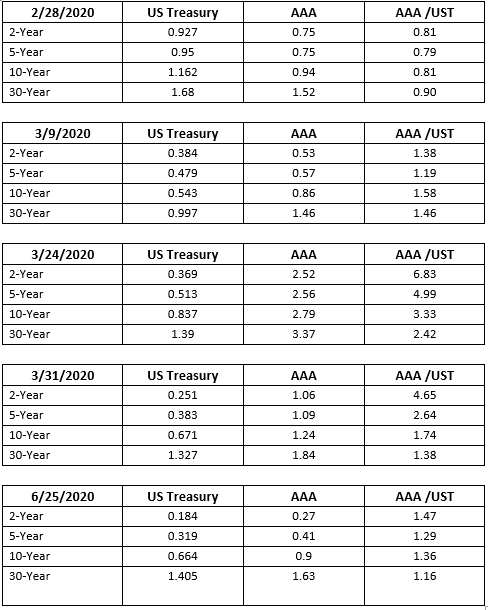
The Muni Selloff That Was
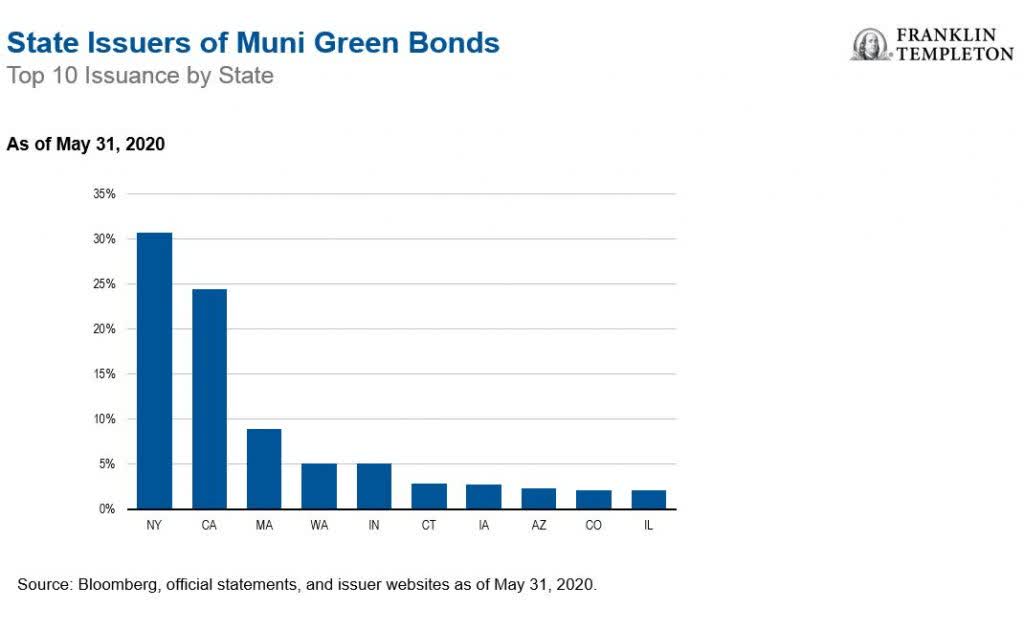
Responsible Investing In A Traditional Asset Class
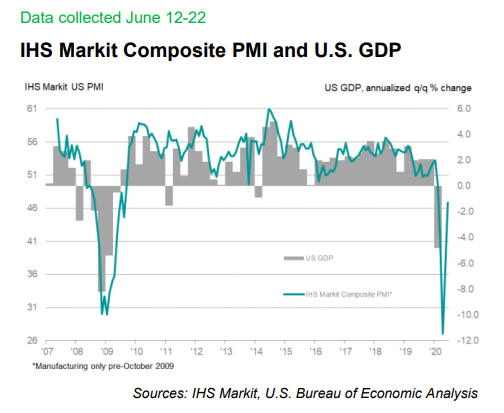
The Reopening Killed The V-Shaped Recovery
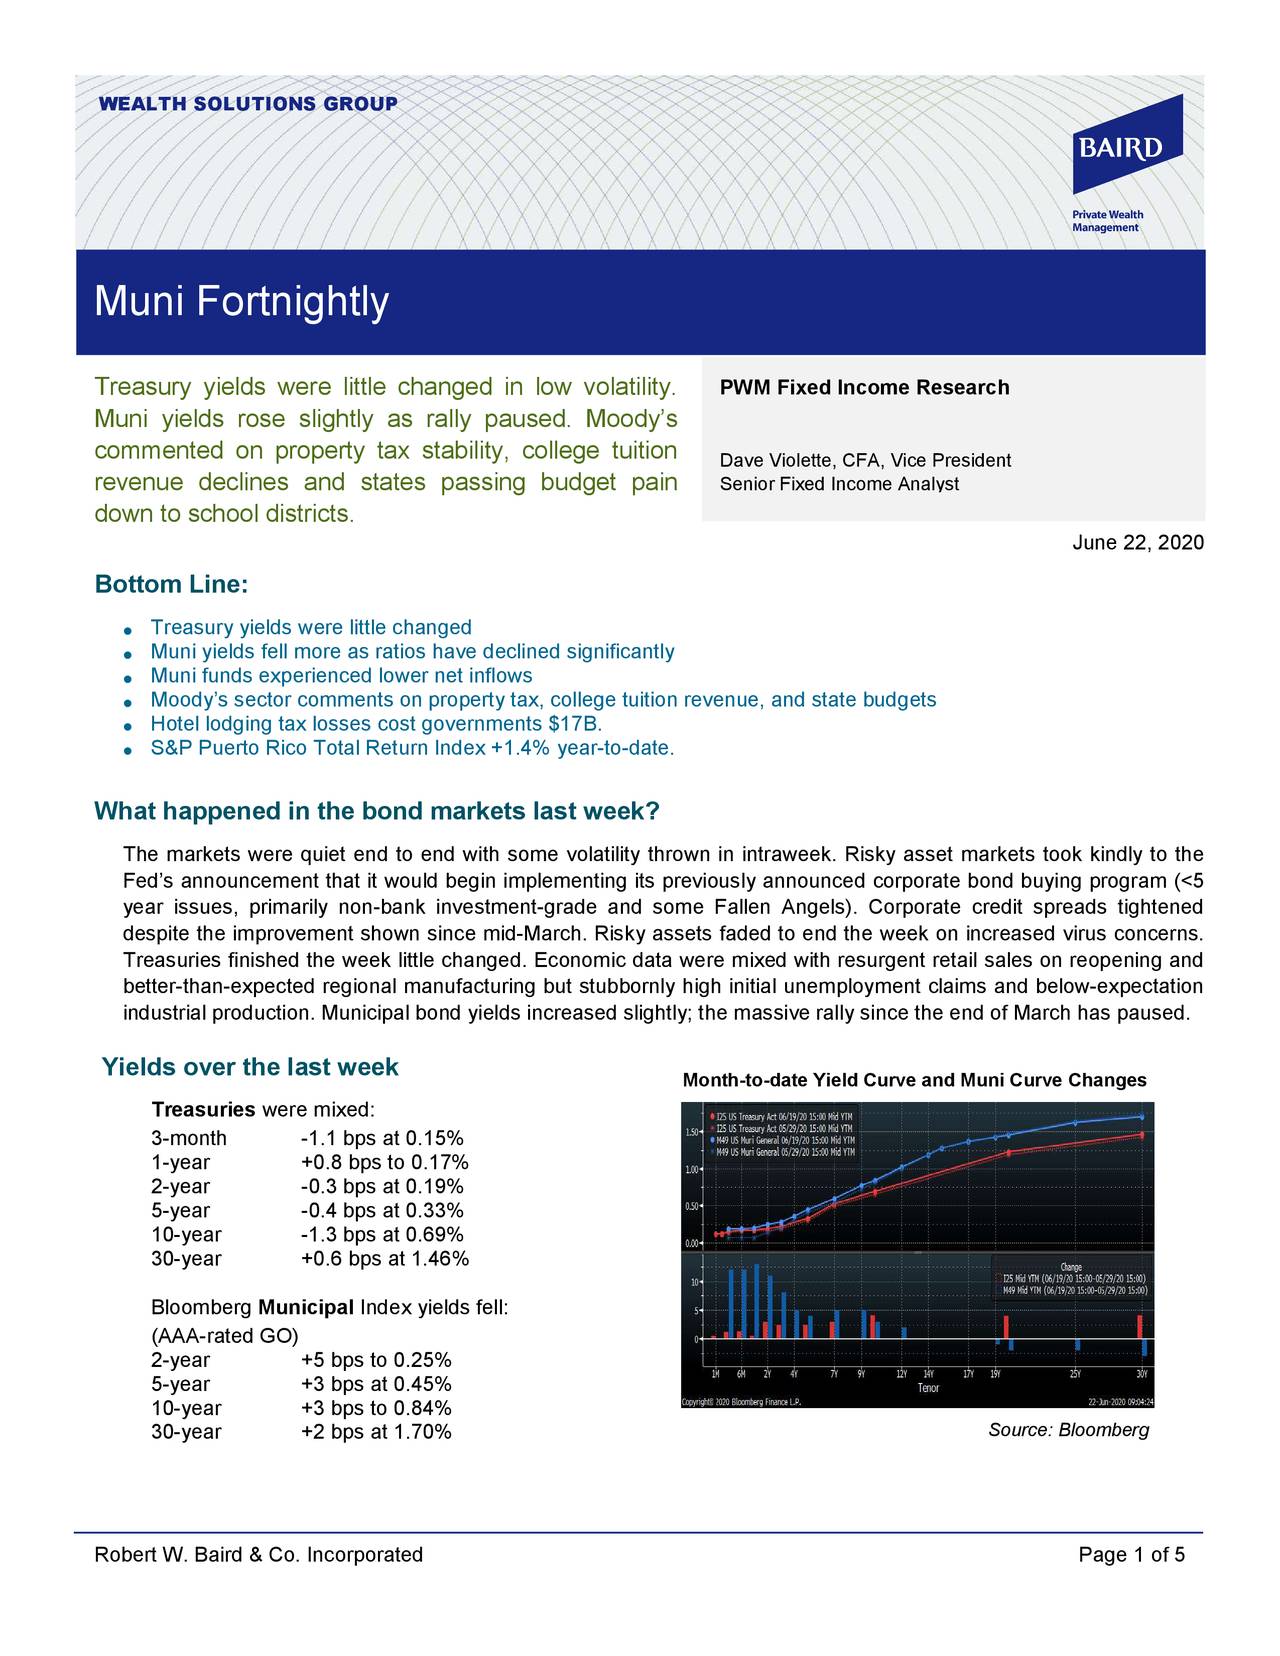
Treasury Yields Were Little Changed In Low Volatility - Muni Fortnightly, June 22, 2020
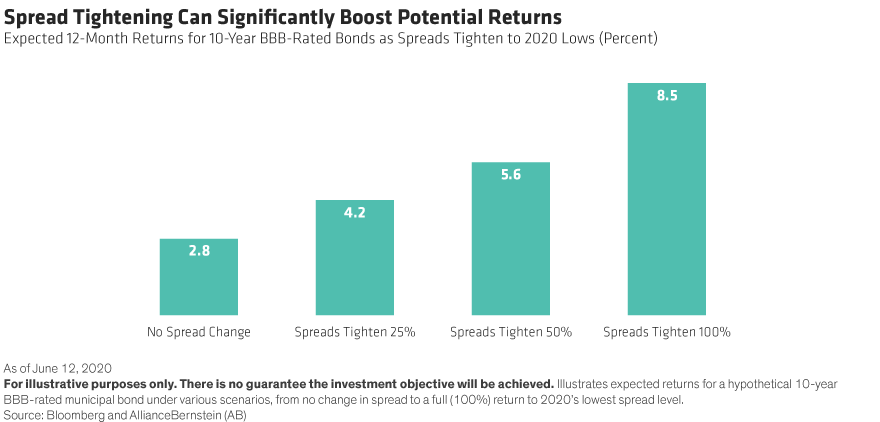
Mid-Grade Munis Have Room To Rebound

Municipal Bond Perspective: Where We Go From Here

How Municipal Bond Issuers Will Navigate The Crisis
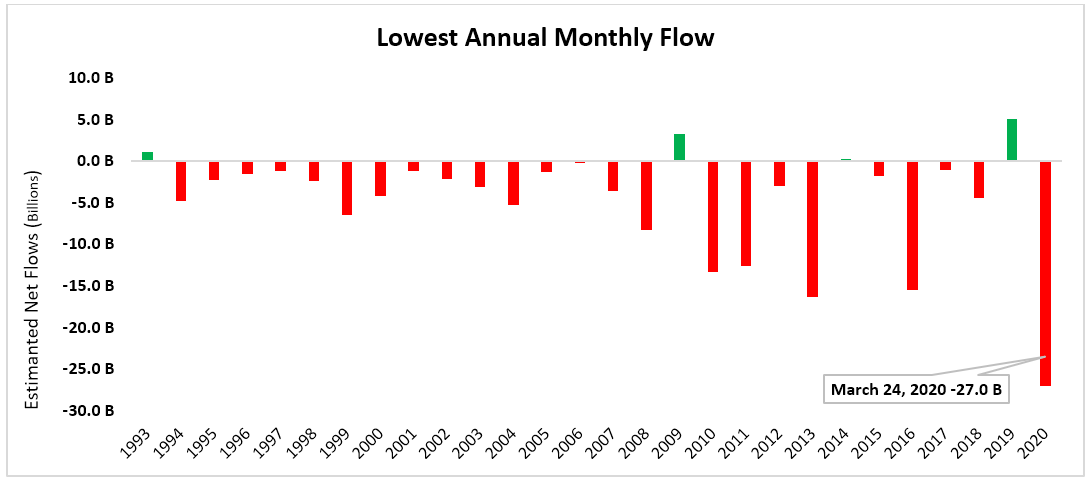
Municipal Bonds: Volatility Is Creating A Potential Opportunity, But Choose Carefully
Source: https://incomestatements.info
Category: Stock Reports
