See more : Adial Pharmaceuticals, Inc. WT EXP 073123 (ADILW) Income Statement Analysis – Financial Results
Complete financial analysis of BlackRock MuniVest Fund, Inc. (MVF) income statement, including revenue, profit margins, EPS and key performance metrics. Get detailed insights into the financial performance of BlackRock MuniVest Fund, Inc., a leading company in the Asset Management industry within the Financial Services sector.
- Diamond Fields Resources Inc. (DFIFF) Income Statement Analysis – Financial Results
- British Automotive Holding S.A. (BAH.WA) Income Statement Analysis – Financial Results
- Bimetal Bearings Limited (BIMETAL.BO) Income Statement Analysis – Financial Results
- Fortis Healthcare Limited (FORTIS.BO) Income Statement Analysis – Financial Results
- 3i Group plc (TGOPF) Income Statement Analysis – Financial Results
BlackRock MuniVest Fund, Inc. (MVF)
Industry: Asset Management
Sector: Financial Services
Website: https://www.blackrock.com/investing/products/240201/blackrock-munivest-fund-inc-usd-fund
About BlackRock MuniVest Fund, Inc.
BlackRock MuniVest Fund, Inc. is a closed-ended fixed income mutual fund launched by BlackRock, Inc. It is managed by BlackRock Advisors, LLC. The fund invests in the fixed income markets of the United States. It primarily invests in investment grade, long term municipal obligations that are exempt from federal income taxes. The fund seeks to invest in securities with maturities of more than ten years. BlackRock MuniVest Fund, Inc. was formed on September 29, 1988 and is domiciled in the United States.
| Metric | 2024 | 2023 | 2022 | 2021 | 2020 | 2019 | 2018 | 2017 | 2016 | 2015 | 2014 | 2013 | 2012 | 2011 | 2010 |
|---|---|---|---|---|---|---|---|---|---|---|---|---|---|---|---|
| Revenue | 33.03M | 3.75M | 25.86M | 57.52M | 12.16M | 62.21M | 8.43M | -2.85M | 62.68M | 27.09M | 116.28M | -52.65M | 117.71M | 17.51M | 107.00M |
| Cost of Revenue | 0.00 | 4.15M | 4.94M | 5.20M | 5.08M | 5.01M | 5.24M | 5.44M | 5.59M | 0.00 | 0.00 | 0.00 | 0.00 | 0.00 | 0.00 |
| Gross Profit | 33.03M | -394.42K | 20.92M | 52.32M | 7.08M | 57.20M | 3.19M | -8.29M | 57.10M | 27.09M | 116.28M | -52.65M | 117.71M | 17.51M | 107.00M |
| Gross Profit Ratio | 100.00% | -10.51% | 80.88% | 90.96% | 58.24% | 91.94% | 37.83% | 290.76% | 91.09% | 100.00% | 100.00% | 100.00% | 100.00% | 100.00% | 100.00% |
| Research & Development | 0.00 | -3.40 | -3.69 | 1.52 | 0.38 | 1.63 | 0.16 | -0.07 | 1.23 | 0.00 | 0.00 | 0.00 | 0.00 | 0.00 | 0.00 |
| General & Administrative | 3.78M | 341.72K | 5.14M | 399.08K | 390.85K | 434.45K | 450.78K | 525.76K | 507.89K | 521.93K | 515.22K | 449.24K | 844.39K | 990.82K | 1.05M |
| Selling & Marketing | 0.00 | 0.00 | 0.00 | 0.00 | 0.00 | 0.00 | 0.00 | 0.00 | 0.00 | 0.00 | 0.00 | 0.00 | 0.00 | 0.00 | 0.00 |
| SG&A | 3.78M | 341.72K | -3.69 | 399.08K | 390.85K | 434.45K | 450.78K | 525.76K | 507.89K | 521.93K | 515.22K | 449.24K | 844.39K | 990.82K | 1.05M |
| Other Expenses | 0.00 | -1.20M | 64.84M | 47.41K | 47.36K | 43.59K | 48.88K | 51.36K | 55.22K | 59.04K | 56.81K | 56.06K | 73.75K | 87.60K | 83.41K |
| Operating Expenses | 3.78M | 1.20M | 125.34M | 446.50K | 438.21K | 478.04K | 499.66K | 577.12K | 563.11K | 580.97K | 572.03K | 505.30K | 918.14K | 1.08M | 1.13M |
| Cost & Expenses | 3.78M | 5.35M | 20.92M | 446.50K | 438.21K | 478.04K | 499.66K | 577.12K | 563.11K | 580.97K | 572.03K | 505.30K | 918.14K | 1.08M | 1.13M |
| Interest Income | 32.13M | 31.22M | 4.23M | 35.33M | 38.47M | 42.49M | 46.24M | 47.99M | 49.14M | 48.84M | 49.87M | 53.17M | 53.34M | 53.57M | 52.68M |
| Interest Expense | 11.24M | 11.15M | 4.23M | 3.20M | 5.67M | 8.62M | 7.84M | 6.40M | 4.32M | 3.54M | 3.62M | 4.24M | 3.41M | 1.36M | 1.13M |
| Depreciation & Amortization | -29.24M | -28.14M | -29.10M | -29.94M | -33.28M | -37.34M | -40.84M | -42.32M | -43.31M | -43.03M | 3.62M | 126.16K | 70.33K | 1.36M | 1.13M |
| EBITDA | 0.00 | -1.60M | -91.09M | 0.00 | 0.00 | 0.00 | 0.00 | 2.97M | 0.00 | 0.00 | -67.86M | 0.00 | 0.00 | 0.00 | 0.00 |
| EBITDA Ratio | 0.00% | -42.56% | 452.25% | 99.22% | 96.40% | 99.23% | 187.12% | -104.09% | 105.99% | 110.93% | 102.62% | 92.66% | 102.17% | 101.63% | 100.00% |
| Operating Income | 29.24M | -1.60M | 29.10M | 57.07M | 11.72M | 61.73M | 15.77M | 2.97M | 66.44M | 30.05M | 115.71M | -53.16M | 116.79M | 16.43M | 105.87M |
| Operating Income Ratio | 88.55% | -42.56% | 112.55% | 99.22% | 96.40% | 99.23% | 187.12% | -104.09% | 105.99% | 110.93% | 99.51% | 100.96% | 99.22% | 93.84% | 98.94% |
| Total Other Income/Expenses | 960.00 | -40.89M | -124.43M | 0.00 | -21.56M | 0.00 | -32.91M | -45.75M | 18.81M | -16.52M | 71.48M | -100.28M | 0.00 | 0.00 | 0.00 |
| Income Before Tax | 29.25M | -12.74M | -95.32M | 57.07M | 11.72M | 61.73M | 7.93M | -3.43M | 62.12M | 26.51M | 115.71M | -53.16M | 116.79M | 16.43M | 105.87M |
| Income Before Tax Ratio | 88.55% | -339.60% | -368.61% | 99.22% | 96.40% | 99.23% | 94.07% | 120.23% | 99.10% | 97.86% | 99.51% | 100.96% | 99.22% | 93.84% | 98.94% |
| Income Tax Expense | 0.00 | 28.14M | -91.09M | 26.74M | 27.61M | 28.72M | -161.14K | 42.32M | 43.31M | 43.03M | 71.48M | 4.24M | 3.41M | 0.00 | 0.00 |
| Net Income | 29.25M | -12.74M | -91.09M | 57.07M | 11.72M | 61.73M | 7.93M | -3.43M | 62.12M | 26.51M | 115.71M | -53.16M | 116.79M | 16.43M | 105.87M |
| Net Income Ratio | 88.55% | -339.60% | -352.25% | 99.22% | 96.40% | 99.23% | 94.07% | 120.23% | 99.10% | 97.86% | 99.51% | 100.96% | 99.22% | 93.84% | 98.94% |
| EPS | 0.46 | -0.20 | 0.96 | 0.88 | 0.18 | 0.95 | 0.12 | -0.06 | 0.97 | 0.41 | 1.81 | -0.83 | 0.71 | 0.24 | 1.68 |
| EPS Diluted | 0.46 | -0.20 | 67.59M | 0.88 | 0.18 | 0.95 | 0.12 | -0.06 | 0.97 | 0.41 | 1.81 | -0.83 | 0.71 | 0.24 | 1.68 |
| Weighted Avg Shares Out | 63.45M | 64.05M | -95.32M | 64.84M | 64.84M | 64.84M | 64.84M | 57.16M | 64.04M | 64.04M | 63.93M | 63.98M | 63.62M | 63.08M | 62.46M |
| Weighted Avg Shares Out (Dil) | 63.45M | 64.05M | -1.35 | 64.84M | 64.84M | 64.84M | 66.09M | 57.16M | 64.04M | 64.65M | 63.93M | 64.04M | 63.62M | 63.08M | 62.46M |
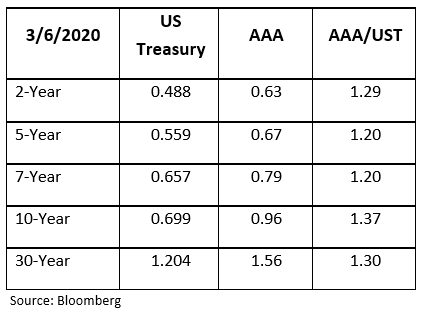
The Muni Meltdown Timeline (And The Opportunity It Presents)

The Fed Enters The Municipal Bond Market To Lend Cities A Hand, But Will It Be Enough?
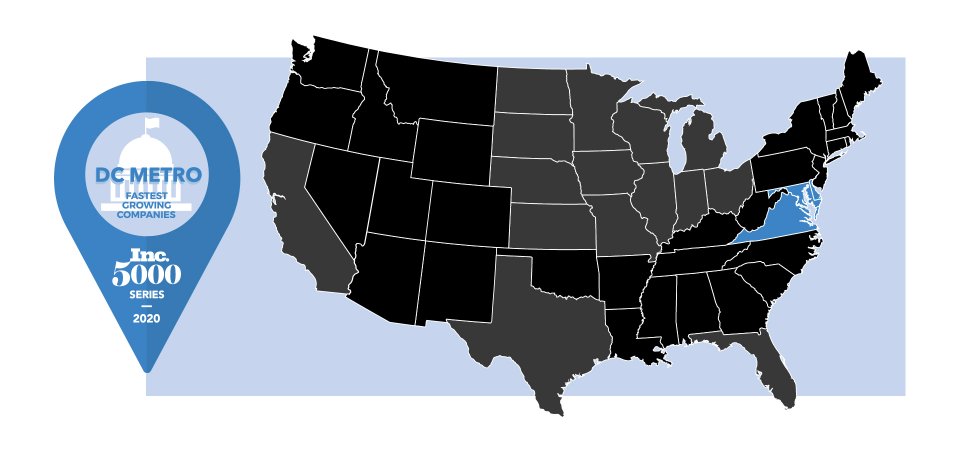
Introducing the Inc. 5000 Series: D.C. Metro's Top Companies

BlackRock MuniVest Fund, Inc. -- Moody's announces completion of a periodic review of ratings of BlackRock MuniVest Fund, Inc.
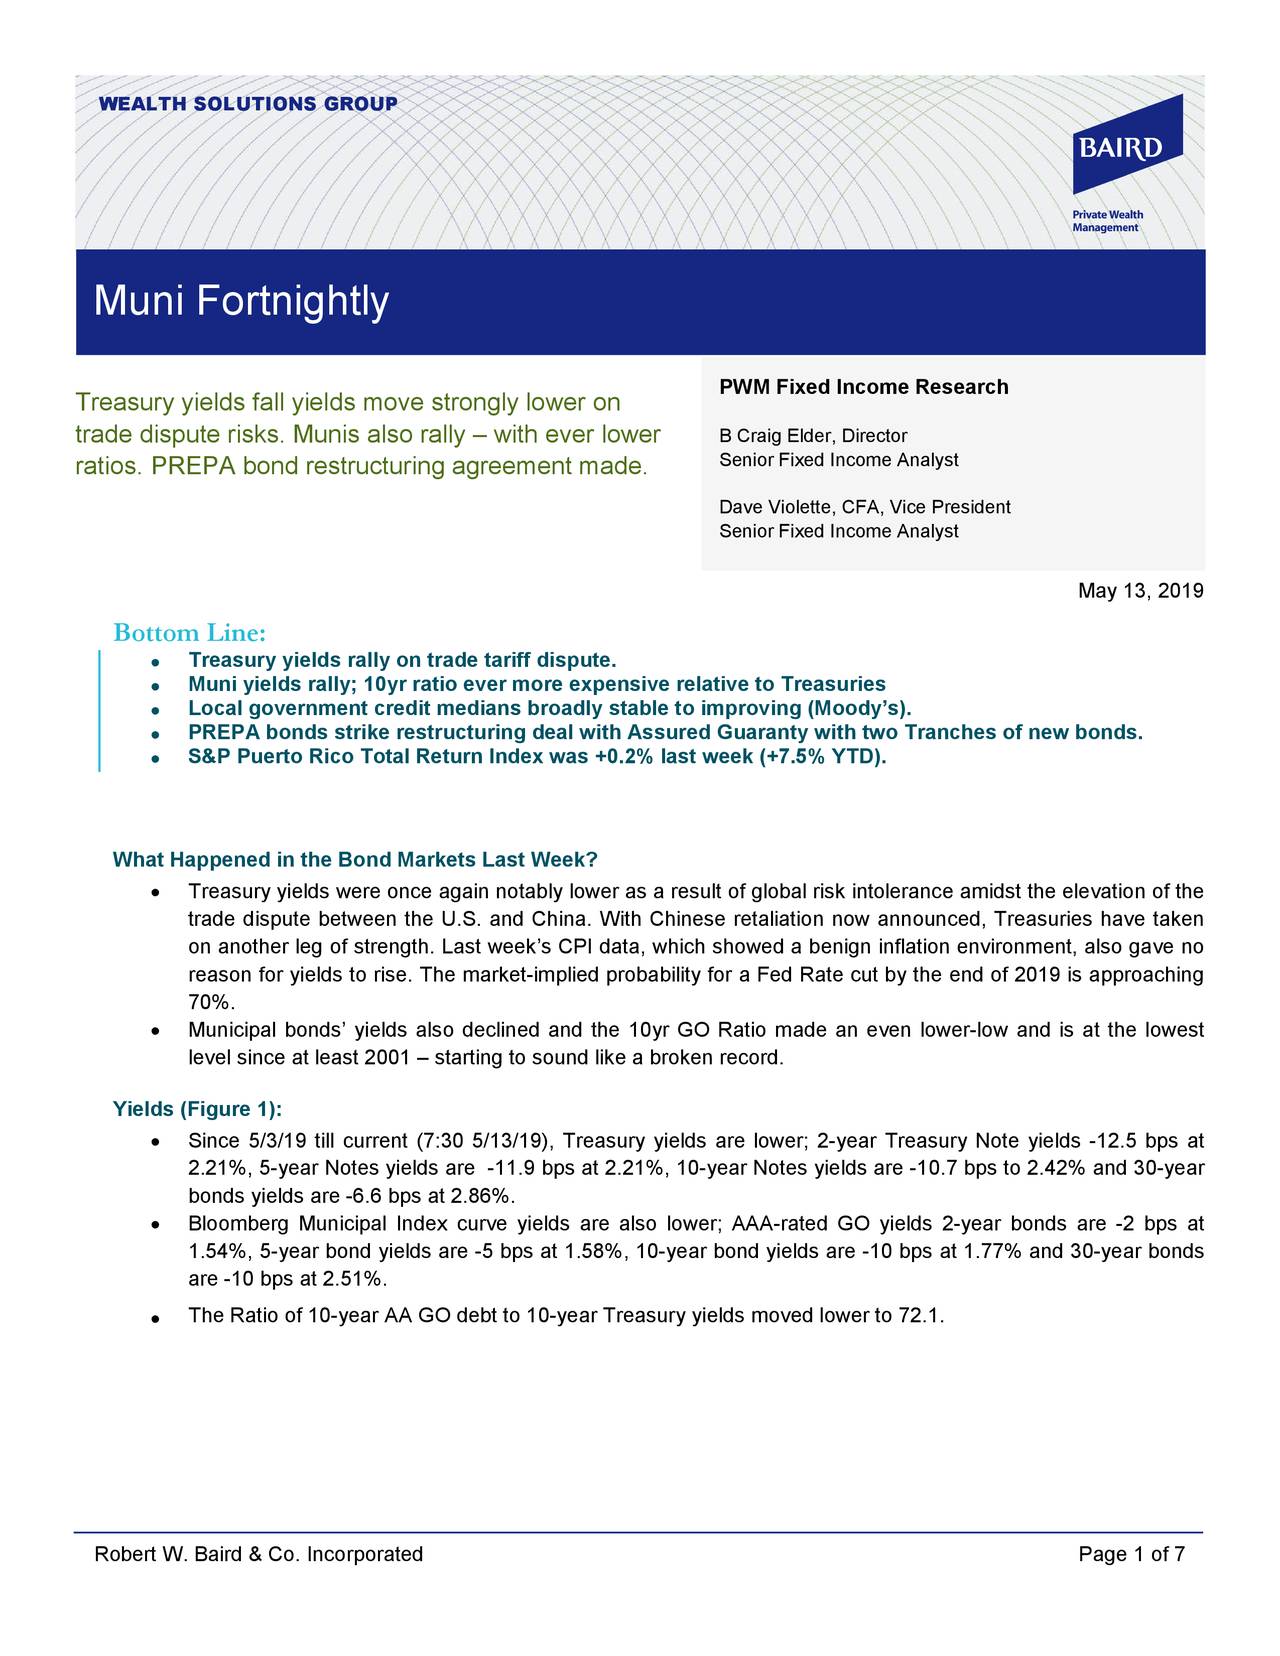
Muni Fortnightly - May 13, 2019
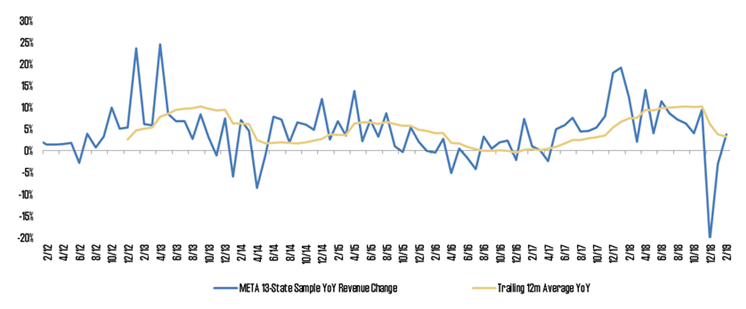
Q1 2019 Credit Commentary
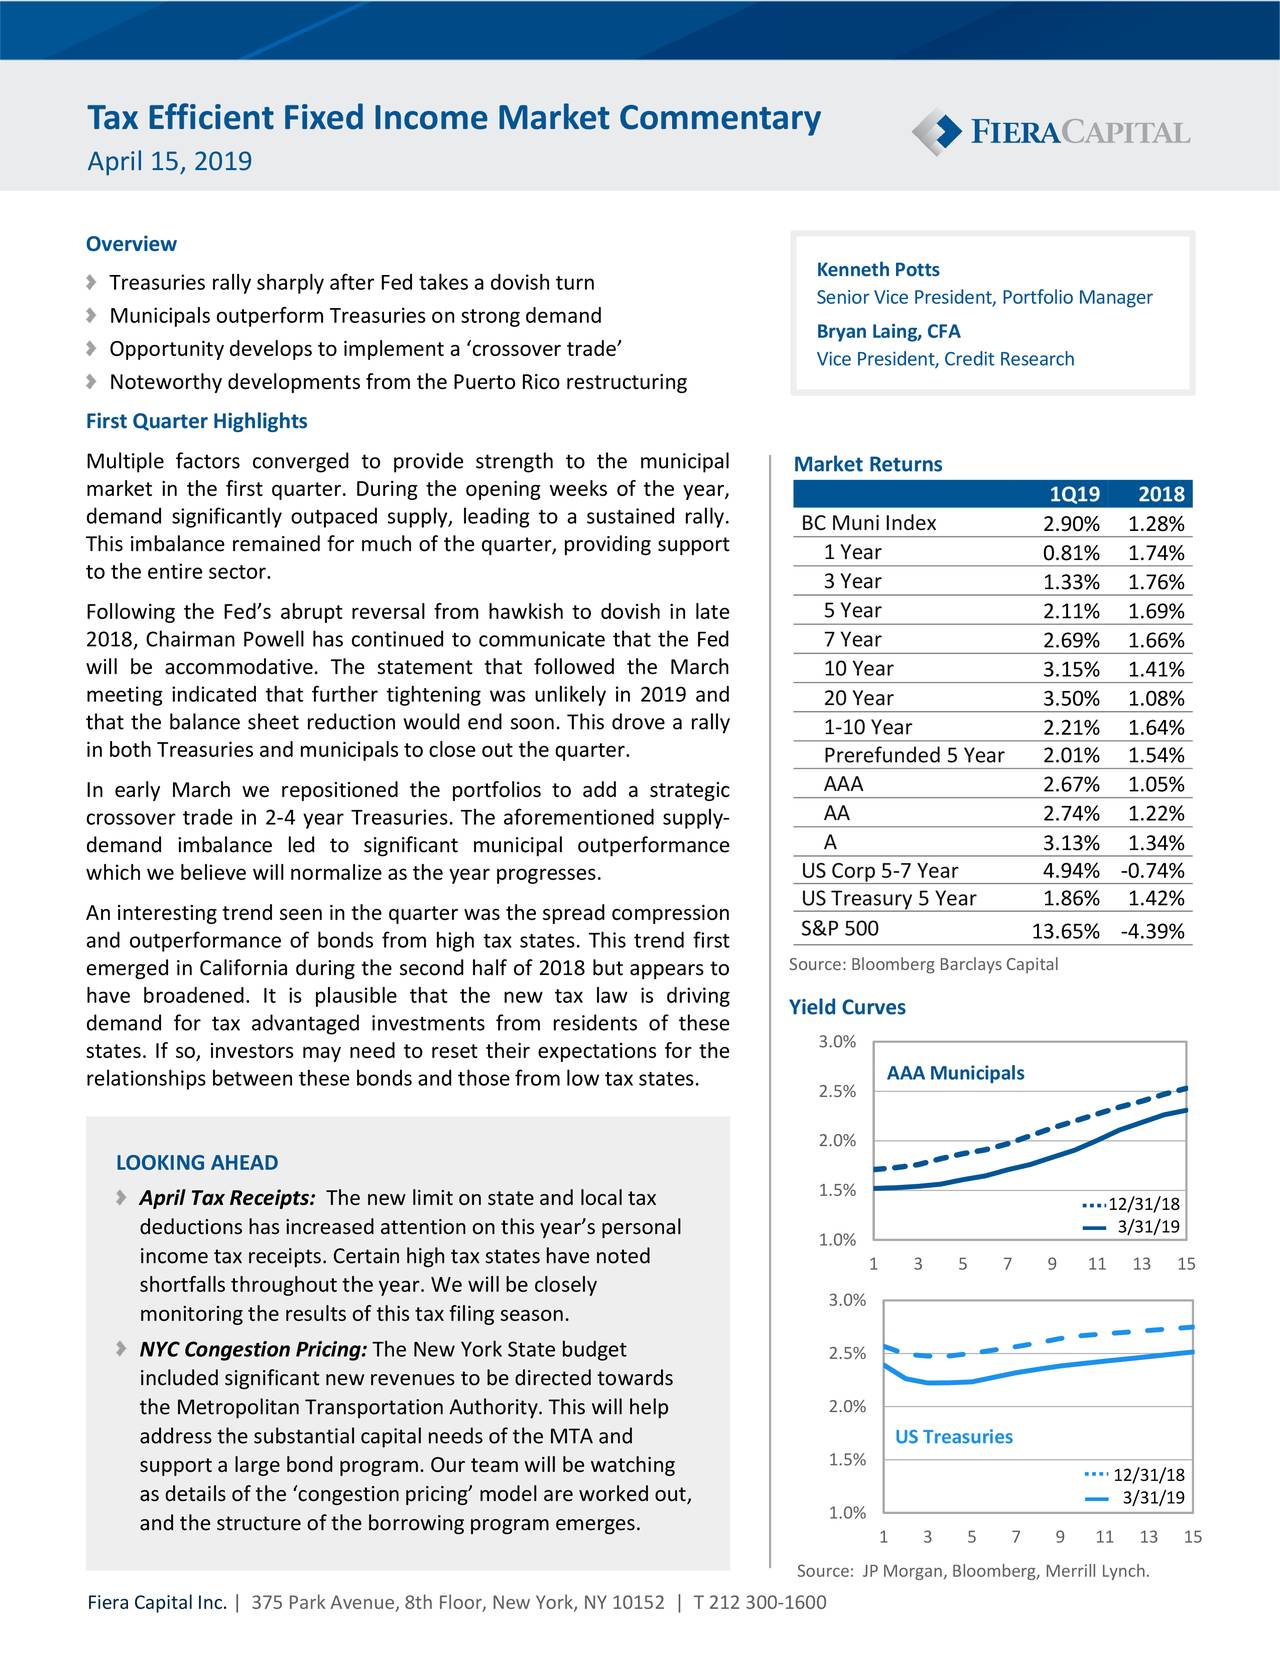
Fiera Capital Tax-Efficient Fixed Income 1st Quarter Market Commentary
Source: https://incomestatements.info
Category: Stock Reports
