See more : Luvu Brands, Inc. (LUVU) Income Statement Analysis – Financial Results
Complete financial analysis of NovaGold Resources Inc. (NG) income statement, including revenue, profit margins, EPS and key performance metrics. Get detailed insights into the financial performance of NovaGold Resources Inc., a leading company in the Gold industry within the Basic Materials sector.
- Bondada Engineering Limited (BONDADA.BO) Income Statement Analysis – Financial Results
- ProText Mobility, Inc. (TXTM) Income Statement Analysis – Financial Results
- Queen City Investments, Inc. (QUCT) Income Statement Analysis – Financial Results
- Heartland Express, Inc. (HTLD) Income Statement Analysis – Financial Results
- Far East Orchard Limited (O10.SI) Income Statement Analysis – Financial Results
NovaGold Resources Inc. (NG)
About NovaGold Resources Inc.
NovaGold Resources Inc. explores for and develops gold mineral properties in the United States. Its principal asset is the Donlin Gold project consisting of 493 mining claims covering an area of approximately 29,008 hectares located in the Kuskokwim region of southwestern Alaska. The company was formerly known as NovaCan Mining Resources (1985) Limited and changed its name to NovaGold Resources Inc. in March 1987. NovaGold Resources Inc. was incorporated in 1984 and is based in Vancouver, Canada.
| Metric | 2023 | 2022 | 2021 | 2020 | 2019 | 2018 | 2017 | 2016 | 2015 | 2014 | 2013 | 2012 | 2011 | 2010 | 2009 | 2008 | 2007 | 2006 | 2005 | 2004 | 2003 | 2002 | 2001 | 2000 | 1999 | 1998 | 1997 | 1996 |
|---|---|---|---|---|---|---|---|---|---|---|---|---|---|---|---|---|---|---|---|---|---|---|---|---|---|---|---|---|
| Revenue | 0.00 | 0.00 | 0.00 | 0.00 | 0.00 | 0.00 | 0.00 | 0.00 | 0.00 | 0.00 | 0.00 | 0.00 | 388.34K | 587.53K | 1.52M | 3.54M | 7.07M | 7.27M | 3.15M | 3.16M | 1.23M | 1.48M | 1.80M | 1.82M | 2.11M | 65.10K | 70.27K | 74.21K |
| Cost of Revenue | 9.96K | 7.00K | 7.00K | 7.00K | 15.00K | 22.00K | 34.00K | 33.00K | 0.00 | 0.00 | 0.00 | 7.35M | 215.96K | 253.06K | 37.65M | 39.95M | 165.13K | 184.07K | 366.93K | 237.11K | 256.07K | 151.98K | 138.54K | 1.26M | 1.22M | 0.00 | 0.00 | 0.00 |
| Gross Profit | -9.96K | -7.00K | -7.00K | -7.00K | -15.00K | -22.00K | -34.00K | -33.00K | 0.00 | 0.00 | 0.00 | -7.35M | 172.38K | 334.47K | -36.13M | -36.42M | 6.91M | 7.09M | 2.79M | 2.92M | 970.27K | 1.33M | 1.66M | 551.47K | 882.83K | 65.10K | 70.27K | 74.21K |
| Gross Profit Ratio | 0.00% | 0.00% | 0.00% | 0.00% | 0.00% | 0.00% | 0.00% | 0.00% | 0.00% | 0.00% | 0.00% | 0.00% | 44.39% | 56.93% | -2,375.20% | -1,029.75% | 97.67% | 97.47% | 88.36% | 92.50% | 79.12% | 89.75% | 92.28% | 30.36% | 41.94% | 100.00% | 100.00% | 100.00% |
| Research & Development | 0.00 | 0.00 | 0.00 | 0.00 | 0.00 | 0.00 | 0.00 | 0.00 | 0.00 | 0.00 | 0.00 | 878.84K | 484.21K | 1.25M | 1.40M | 0.00 | 0.00 | 0.00 | 0.00 | 0.00 | 0.00 | 0.00 | 0.00 | 0.00 | 0.00 | 0.00 | 0.00 | 0.00 |
| General & Administrative | 21.78M | 20.10M | 20.20M | 18.73M | 16.31M | 18.47M | 20.77M | 20.15M | 19.89M | 22.05M | 26.99M | 44.05M | 86.05M | 44.39M | 22.24M | 0.00 | 0.00 | 0.00 | 0.00 | 0.00 | 0.00 | 0.00 | 0.00 | 0.00 | 0.00 | 0.00 | 0.00 | 0.00 |
| Selling & Marketing | -10.00K | 0.00 | 0.00 | 0.00 | 0.00 | 0.00 | 0.00 | 0.00 | 0.00 | 0.00 | 0.00 | 0.00 | 0.00 | 0.00 | 0.00 | 0.00 | 0.00 | 0.00 | 0.00 | 0.00 | 0.00 | 0.00 | 0.00 | 0.00 | 0.00 | 0.00 | 0.00 | 0.00 |
| SG&A | 21.77M | 20.10M | 20.20M | 18.73M | 16.31M | 18.47M | 20.77M | 20.15M | 19.89M | 22.05M | 26.99M | 44.05M | 86.05M | 44.39M | 22.24M | 27.19M | 113.92M | 34.13M | 9.70M | 10.00M | 4.15M | 3.18M | 1.46M | 963.55K | 1.36M | 1.11M | 632.47K | 519.48K |
| Other Expenses | 0.00 | -849.00K | 2.76M | 3.34M | 92.00K | 0.00 | 0.00 | 0.00 | 401.00K | 36.00K | 37.00K | 0.00 | -19.77M | 11.52M | 2.61M | -4.45M | 920.74K | 404.16K | 426.75K | 0.00 | 92.03K | 0.00 | 47.68K | 102.53K | 271.64K | 325.52K | 351.37K | 148.42K |
| Operating Expenses | 21.68M | 19.25M | 20.20M | 18.73M | 16.31M | 18.47M | 20.77M | 20.15M | 20.29M | 22.08M | 27.03M | 44.93M | 108.62M | 57.16M | 26.24M | 22.74M | 114.84M | 34.53M | 10.12M | 10.00M | 4.25M | 3.18M | 1.51M | 1.07M | 1.63M | 1.43M | 983.84K | 667.90K |
| Cost & Expenses | 21.69M | 19.26M | 20.21M | 18.74M | 16.32M | 18.49M | 20.80M | 20.18M | 20.29M | 22.08M | 27.03M | 52.28M | 108.84M | 57.41M | 63.90M | 62.69M | 115.00M | 34.72M | 10.49M | 10.24M | 4.50M | 3.33M | 1.64M | 2.33M | 2.85M | 1.43M | 983.84K | 667.90K |
| Interest Income | 5.77M | 1.59M | 458.00K | 1.74M | 4.19M | 2.00M | 1.17M | 947.00K | 740.00K | 854.00K | 942.00K | 1.52M | 395.12K | 565.95K | 391.42K | 1.80M | 0.00 | 0.00 | 0.00 | 0.00 | 0.00 | 0.00 | 0.00 | 0.00 | 0.00 | 0.00 | 0.00 | 0.00 |
| Interest Expense | 13.01M | 7.96M | 5.92M | 6.01M | 7.29M | 6.46M | 5.23M | 4.55M | 5.19M | 6.84M | 12.61M | 15.68M | 14.55M | 14.90M | 17.46M | 94.26M | 0.00 | 647.25K | 0.00 | 72.03K | 2.19M | 321.96K | 172.25K | 0.00 | 475.37K | 4.04M | 1.41M | 0.00 |
| Depreciation & Amortization | 9.96K | 6.75K | 6.86K | 7.26K | 15.01K | 21.37K | 34.38K | 32.60K | 35.00K | 36.00K | 37.00K | 334.22K | 836.72K | 516.91K | 243.93K | 228.38K | 286.23K | 211.08K | 184.46K | 177.08K | 122.03K | 175.98K | 147.91K | 102.53K | 271.64K | -130.21K | 210.82K | -222.63K |
| EBITDA | -33.55M | -16.64M | -17.50M | -14.34M | -8.70M | -23.76M | -31.69M | -28.63M | -25.16M | -38.01M | -55.78M | 40.77M | 7.82M | -191.81M | -64.36M | -145.42M | -107.64M | -27.23M | -7.15M | -7.11M | -4.38M | -1.67M | 406.24K | -412.08K | -475.37K | 2.67M | 491.92K | -593.69K |
| EBITDA Ratio | 0.00% | 0.00% | 0.00% | 0.00% | 0.00% | 0.00% | 0.00% | 0.00% | 0.00% | 0.00% | 0.00% | 0.00% | -27,227.19% | -11,633.90% | -4,230.52% | 603.55% | -1,529.83% | -364.01% | -241.33% | -216.18% | -81.08% | -90.96% | 26.26% | -182.67% | -61.29% | 4,100.01% | 700.00% | -800.01% |
| Operating Income | -21.78M | -48.27M | -36.84M | -33.24M | -26.81M | -27.29M | -33.70M | -30.15M | -31.70M | -38.01M | -55.78M | -79.54M | -88.28M | -56.26M | -79.84M | -59.16M | -107.93M | -27.44M | -7.34M | -7.08M | -4.50M | -2.43M | -207.66K | 2.35M | -1.29M | -5.40M | -2.32M | -593.69K |
| Operating Income Ratio | 0.00% | 0.00% | 0.00% | 0.00% | 0.00% | 0.00% | 0.00% | 0.00% | 0.00% | 0.00% | 0.00% | 0.00% | -22,733.92% | -9,574.96% | -5,248.35% | -1,672.81% | -1,526.01% | -377.27% | -232.73% | -224.07% | -366.80% | -163.86% | -11.57% | 129.22% | -61.29% | -8,300.02% | -3,300.00% | -800.01% |
| Total Other Income/Expenses | -24.78M | -5.10M | -3.56M | -1.11M | -10.16M | -3.65M | -3.32M | -3.01M | -11.51M | -18.14M | -31.32M | 25.26M | -103.02M | -150.85M | -24.32M | -91.18M | 46.63M | -647.25K | 137.60K | 236.11K | -858.24K | 260.97K | 80.19K | -2.35M | 67.91K | -4.04M | -1.41M | 0.00 |
| Income Before Tax | -46.56M | -53.38M | -40.40M | -34.35M | -26.48M | -30.94M | -38.28M | -33.57M | -31.80M | -40.22M | -58.86M | 61.16M | -191.31M | -200.79M | -75.09M | -153.42M | -61.30M | -28.09M | -7.20M | -7.15M | -5.46M | -2.17M | -20.89K | 2.39M | -1.22M | -9.44M | -3.72M | 0.00 |
| Income Before Tax Ratio | 0.00% | 0.00% | 0.00% | 0.00% | 0.00% | 0.00% | 0.00% | 0.00% | 0.00% | 0.00% | 0.00% | 0.00% | -49,262.61% | -34,175.31% | -4,936.36% | -4,338.33% | -866.69% | -386.16% | -228.37% | -226.35% | -445.51% | -146.26% | -1.16% | 131.65% | -58.06% | -14,500.04% | -5,300.01% | 0.00% |
| Income Tax Expense | 38.83K | -33.00K | 137.00K | -781.00K | 1.28M | 526.00K | 732.00K | 277.00K | 153.00K | 263.00K | 3.90M | -6.93M | -7.07M | -1.14M | -5.73M | 3.24M | -16.55M | -1.41M | -2.23M | -25.01K | 2.08M | 361.95K | 465.67K | -2.28M | 814.92K | 130.21K | -210.82K | 222.63K |
| Net Income | -46.80M | -53.34M | -40.54M | -33.56M | -27.76M | -112.77M | -39.02M | -33.85M | -31.95M | -40.48M | -62.76M | 68.09M | -148.32M | -199.65M | -69.36M | -156.66M | -44.74M | -26.68M | -4.97M | -7.05M | -5.36M | -2.21M | -314.31K | 1.76M | -1.56M | -5.53M | -2.11M | -816.33K |
| Net Income Ratio | 0.00% | 0.00% | 0.00% | 0.00% | 0.00% | 0.00% | 0.00% | 0.00% | 0.00% | 0.00% | 0.00% | 0.00% | -38,192.78% | -33,981.49% | -4,559.60% | -4,429.87% | -632.63% | -366.74% | -157.72% | -223.27% | -436.79% | -148.95% | -17.51% | 97.05% | -74.19% | -8,500.02% | -3,000.00% | -1,100.01% |
| EPS | -0.14 | -0.16 | -0.12 | -0.10 | -0.09 | -0.35 | -0.12 | -0.11 | -0.10 | -0.13 | -0.20 | 0.25 | -0.63 | -0.93 | -0.40 | -1.48 | -0.45 | -0.29 | -0.07 | -0.12 | -0.11 | -0.06 | -0.01 | 0.08 | -0.09 | -0.49 | -0.21 | -0.15 |
| EPS Diluted | -0.14 | -0.16 | -0.12 | -0.10 | -0.09 | -0.35 | -0.12 | -0.11 | -0.10 | -0.13 | -0.20 | 0.25 | -0.53 | -0.93 | -0.40 | -1.48 | -0.45 | -0.29 | -0.07 | -0.12 | -0.11 | -0.06 | -0.01 | 0.05 | -0.09 | -0.49 | -0.21 | -0.15 |
| Weighted Avg Shares Out | 334.06M | 333.24M | 331.55M | 329.27M | 325.79M | 322.49M | 321.66M | 319.77M | 317.85M | 317.20M | 313.37M | 272.24M | 236.12M | 213.60M | 172.65M | 105.73M | 99.56M | 91.52M | 66.95M | 59.16M | 48.68M | 35.93M | 24.70M | 20.82M | 17.14M | 11.18M | 10.00M | 5.50M |
| Weighted Avg Shares Out (Dil) | 334.06M | 333.24M | 331.55M | 329.27M | 325.79M | 322.49M | 321.66M | 319.77M | 317.85M | 317.20M | 313.37M | 272.24M | 277.58M | 213.60M | 172.65M | 105.73M | 99.56M | 91.52M | 66.95M | 59.16M | 48.68M | 35.93M | 24.70M | 33.83M | 17.14M | 11.18M | 10.00M | 5.50M |

ClearBridge International Value Strategy Portfolio Manager Commentary Q2 2020

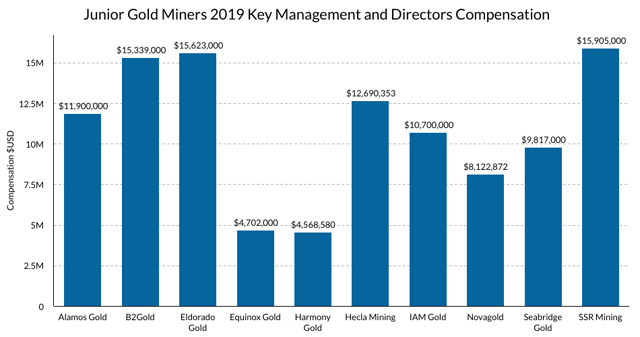
Junior Gold Miners Executive Compensation 2020 Review

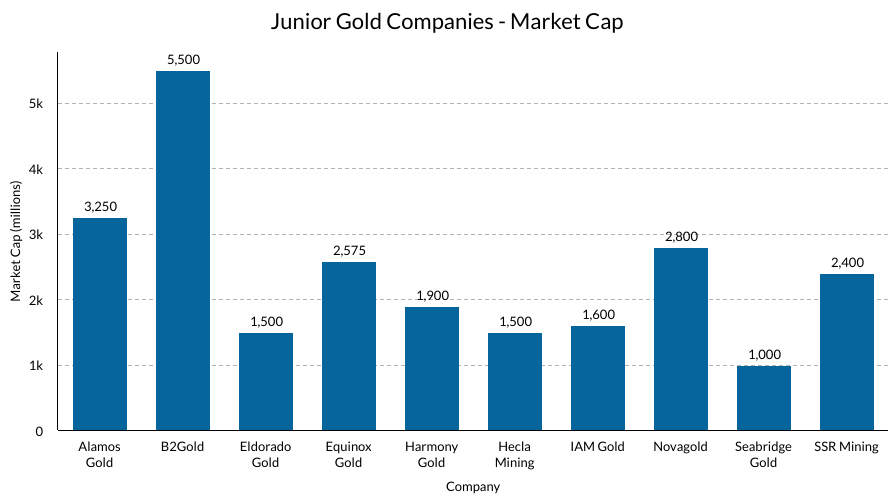
Junior Gold Miners And Their Historical Performance - 2020 Edition

NovaGold Resources Inc. (NG) CEO Greg Lang on Q2 2020 Results - Earnings Call Transcript

Novagold Is The Best Exposure To Hedge Currency Debasement (NYSEMKT:NG)

Eastman Chemical (EMN) Tops Q1 Earnings and Sales Estimates

Dow's (DOW) Earnings Lag Estimates in Q1, Revenues Beat

FMC Corp Issues Update on Liquidity, Expects Strong Q1 Results

Teck Resources (TECK) Misses on Q1 Earnings, Withdraws '20 View

Steel Dynamics' (STLD) Earnings and Sales Top Estimates in Q1
Source: https://incomestatements.info
Category: Stock Reports
