See more : NACL Industries Limited (NACLIND.BO) Income Statement Analysis – Financial Results
Complete financial analysis of Nestlé S.A. (NSRGF) income statement, including revenue, profit margins, EPS and key performance metrics. Get detailed insights into the financial performance of Nestlé S.A., a leading company in the Packaged Foods industry within the Consumer Defensive sector.
- Sapporo Holdings Limited (SOOBF) Income Statement Analysis – Financial Results
- Provenance Gold Corp. (PAU.CN) Income Statement Analysis – Financial Results
- Avery Dennison Corporation (0HJR.L) Income Statement Analysis – Financial Results
- Yatas Yatak ve Yorgan Sanayi ve Ticaret A.S. (YATAS.IS) Income Statement Analysis – Financial Results
- Aastamangalam Finance Limited (AASTAFIN.BO) Income Statement Analysis – Financial Results
Nestlé S.A. (NSRGF)
About Nestlé S.A.
Nestlé S.A., together with its subsidiaries, operates as a food and beverage company. The company operates through Zone Europe, Middle East and North Africa; Zone Americas; and Zone Asia, Oceania and sub-Saharan Africa segments. It offers baby foods under the Cerelac, Gerber, Nido, and NaturNes brands; bottled water under the Nestlé Pure Life, Perrier, and S.Pellegrino brands; cereals under the Fitness, Nesquik, cheerios, and Lion Cereals brands; and chocolate and confectionery products under the KitKat, Nestle L'atelier, Nestle Toll House, Milkybar, Smarties, Quality Street, Aero, Garoto, Orion, and Cailler brands. The company also provides coffee products under the Nescafé, Nespresso, Nescafé Dolce Gusto, Starbucks Coffee At Home, and Blue Bottle Coffee brands; culinary, chilled, and frozen foods under the Maggi, Hot Pockets, Stouffer's, Thomy, Jacks, TombStone, Herta, Buitoni, DiGiorno, and Lean Cuisine brands; dairy products under the Carnation, Nido, Coffee-Mate, and La Laitière brands; and drinks under the Nesquik, Nestea, Nescafé, and Milo brands. In addition, it offers food service products under the Milo, Nescafé, Maggi, Chef, Nestea, Stouffer's, Chef-Mate, Sjora, Minor's, and Lean Cuisine brand names; healthcare nutrition products under the Boost, Peptamen, Resource, Optifast, and Nutren Junior brands; ice cream products under the Dreyer's, Mövenpick, Häagen-Dazs, Nestlé Ice Cream, and Extrême brands; and pet care products under the Purina, ONE, Alpo, Felix, Pro Plan, Cat Chow, Fancy Feast, Bakers, Friskies, Dog Chow, Beneful, and Gourmet brands. The company was founded in 1866 and is headquartered in Vevey, Switzerland.
| Metric | 2023 | 2022 | 2021 | 2020 | 2019 | 2018 | 2017 | 2016 | 2015 | 2014 | 2013 | 2012 | 2011 | 2010 | 2009 | 2008 | 2007 | 2006 | 2005 | 2004 | 2003 | 2002 | 2001 | 2000 | 1999 | 1998 |
|---|---|---|---|---|---|---|---|---|---|---|---|---|---|---|---|---|---|---|---|---|---|---|---|---|---|---|
| Revenue | 93.35B | 94.78B | 87.47B | 84.68B | 92.87B | 91.75B | 90.12B | 89.79B | 89.08B | 91.87B | 92.37B | 92.32B | 83.77B | 104.61B | 100.58B | 109.91B | 107.55B | 98.46B | 91.08B | 86.77B | 87.98B | 89.16B | 84.70B | 81.42B | 74.66B | 71.75B |
| Cost of Revenue | 50.33B | 51.75B | 45.47B | 42.97B | 46.65B | 46.07B | 44.92B | 44.20B | 44.73B | 47.55B | 48.11B | 48.40B | 44.13B | 44.78B | 43.47B | 47.34B | 45.04B | 40.71B | 37.95B | 36.15B | 37.58B | 38.52B | 37.76B | 38.12B | 35.91B | 35.96B |
| Gross Profit | 43.02B | 43.04B | 42.00B | 41.71B | 46.22B | 45.68B | 45.20B | 45.59B | 44.35B | 44.31B | 44.26B | 43.93B | 39.64B | 59.84B | 57.11B | 62.57B | 62.52B | 57.75B | 53.13B | 50.62B | 50.40B | 50.64B | 46.94B | 43.30B | 38.75B | 35.78B |
| Gross Profit Ratio | 46.09% | 45.41% | 48.02% | 49.26% | 49.77% | 49.79% | 50.15% | 50.77% | 49.79% | 48.24% | 47.92% | 47.58% | 47.32% | 57.20% | 56.78% | 56.93% | 58.13% | 58.65% | 58.34% | 58.34% | 57.28% | 56.80% | 55.42% | 53.18% | 51.90% | 49.88% |
| Research & Development | 1.66B | 1.70B | 1.67B | 1.58B | 1.67B | 1.69B | 1.72B | 1.74B | 1.68B | 1.63B | 1.50B | 1.54B | 1.42B | 1.40B | 1.36B | 1.98B | 1.88B | 1.73B | 1.50B | 1.41B | 1.21B | 1.21B | 1.16B | 1.04B | 893.00M | 807.00M |
| General & Administrative | 17.60B | 0.00 | 0.00 | 0.00 | 0.00 | 0.00 | 0.00 | 0.00 | 0.00 | 0.00 | 0.00 | 0.00 | 0.00 | 0.00 | 0.00 | 0.00 | 0.00 | 0.00 | 0.00 | 7.05B | 7.10B | 7.11B | 29.37B | 26.47B | 23.89B | 22.47B |
| Selling & Marketing | 7.77B | 25.24B | 25.21B | 25.23B | 28.29B | 28.47B | 28.75B | 29.54B | 28.64B | 27.87B | 27.87B | 27.86B | 25.00B | 44.40B | 42.53B | 44.92B | 45.62B | 42.71B | 39.91B | 31.20B | 31.08B | 7.11B | 6.42B | 5.88B | 5.27B | 4.89B |
| SG&A | 25.31B | 25.24B | 25.21B | 25.23B | 28.29B | 28.47B | 28.75B | 29.54B | 28.64B | 27.87B | 27.87B | 27.86B | 25.00B | 44.40B | 42.53B | 44.92B | 45.62B | 42.71B | 39.91B | 38.24B | 38.19B | 7.11B | 35.79B | 32.35B | 29.16B | 27.35B |
| Other Expenses | 1.99B | -252.00M | -166.00M | -146.00M | -156.00M | -58.00M | -88.00M | -57.00M | -48.00M | -66.00M | -159.00M | -88.00M | -130.00M | 0.00 | 0.00 | 0.00 | 0.00 | 0.00 | 0.00 | -699.00M | -534.00M | 1.69B | 0.00 | 0.00 | 0.00 | 0.00 |
| Operating Expenses | 28.96B | 26.98B | 26.81B | 27.28B | 30.03B | 30.22B | 30.31B | 31.27B | 30.46B | 30.13B | 28.95B | 29.43B | 26.49B | 47.70B | 44.62B | 39.59B | 47.30B | 44.96B | 42.33B | 41.25B | 40.96B | 41.98B | 37.45B | 33.80B | 30.43B | 28.46B |
| Cost & Expenses | 79.29B | 78.72B | 72.27B | 70.25B | 76.68B | 76.29B | 75.23B | 75.47B | 75.19B | 77.69B | 77.06B | 77.82B | 70.61B | 92.47B | 88.09B | 86.93B | 92.34B | 85.67B | 80.28B | 77.40B | 78.54B | 80.50B | 75.21B | 71.92B | 66.34B | 64.42B |
| Interest Income | 283.00M | 210.00M | 80.00M | 106.00M | 200.00M | 247.00M | 152.00M | 121.00M | 101.00M | 135.00M | 219.00M | 110.00M | 87.00M | 58.00M | 83.00M | 102.00M | 418.00M | 0.00 | 0.00 | 421.00M | 608.00M | 745.00M | 0.00 | 0.00 | 0.00 | 0.00 |
| Interest Expense | 1.64B | 1.25B | 951.00M | 983.00M | 1.21B | 1.01B | 766.00M | 753.00M | 722.00M | 761.00M | 848.00M | 591.00M | 527.00M | 828.00M | 745.00M | 1.10B | 1.48B | 0.00 | 0.00 | 669.00M | 1.20B | 1.41B | 0.00 | 0.00 | 0.00 | 0.00 |
| Depreciation & Amortization | 3.46B | 3.54B | 3.44B | 3.47B | 3.71B | 3.92B | 3.93B | 3.13B | 3.18B | 3.06B | 3.17B | 3.15B | 2.93B | 3.18B | 3.37B | 3.25B | 3.21B | 3.06B | 2.73B | 4.38B | 4.23B | 2.54B | 2.58B | 2.74B | 2.60B | 2.91B |
| EBITDA | 17.80B | 16.08B | 15.20B | 18.37B | 19.17B | 17.92B | 14.24B | 16.41B | 15.68B | 14.09B | 16.45B | 16.53B | 15.51B | 15.39B | 15.95B | 14.63B | 18.21B | 16.58B | 13.68B | 13.29B | 13.14B | 11.21B | 11.89B | 12.24B | 10.91B | 9.91B |
| EBITDA Ratio | 19.07% | 19.96% | 20.61% | 20.61% | 20.64% | 20.65% | 16.80% | 19.01% | 18.84% | 16.75% | 19.94% | 19.13% | 19.29% | 14.70% | 15.82% | 23.94% | 16.89% | 16.10% | 14.85% | 15.05% | 15.62% | 12.57% | 14.58% | 15.41% | 15.16% | 14.58% |
| Operating Income | 14.06B | 12.33B | 11.68B | 14.80B | 16.08B | 13.75B | 10.11B | 13.16B | 12.41B | 10.91B | 13.07B | 13.93B | 12.47B | 11.38B | 11.84B | 21.83B | 14.43B | 12.11B | 10.23B | 8.67B | 8.90B | 8.66B | 9.22B | 9.19B | 7.91B | 7.10B |
| Operating Income Ratio | 15.06% | 13.00% | 13.35% | 17.47% | 17.31% | 14.99% | 11.22% | 14.66% | 13.93% | 11.87% | 14.15% | 15.09% | 14.89% | 10.88% | 11.77% | 19.86% | 13.42% | 12.29% | 11.23% | 9.99% | 10.12% | 9.72% | 10.88% | 11.28% | 10.60% | 9.90% |
| Total Other Income/Expenses | -1.36B | -1.04B | -873.00M | -874.00M | -1.02B | -761.00M | -696.00M | -637.00M | -624.00M | -637.00M | -631.00M | -481.00M | -421.00M | -762.00M | 0.00 | 0.00 | -916.00M | -681.00M | 0.00 | -854.00M | -594.00M | -665.00M | -542.00M | -845.00M | -1.06B | -979.00M |
| Income Before Tax | 12.70B | 11.29B | 10.81B | 13.92B | 15.06B | 12.99B | 9.49B | 12.53B | 11.78B | 10.27B | 12.44B | 13.45B | 12.05B | 11.38B | 11.84B | 21.83B | 13.52B | 12.11B | 10.23B | 8.00B | 8.31B | 9.68B | 8.77B | 8.34B | 6.86B | 6.12B |
| Income Before Tax Ratio | 13.61% | 11.91% | 12.35% | 16.44% | 16.22% | 14.16% | 10.53% | 13.95% | 13.23% | 11.18% | 13.46% | 14.57% | 14.38% | 10.88% | 11.77% | 19.86% | 12.57% | 12.29% | 11.23% | 9.22% | 9.44% | 10.86% | 10.35% | 10.24% | 9.19% | 8.53% |
| Income Tax Expense | 2.31B | 2.73B | 2.26B | 3.37B | 3.16B | 3.44B | 2.78B | 4.41B | 3.31B | 3.37B | 3.26B | 3.45B | 3.11B | 3.34B | 3.09B | 3.79B | 3.42B | 3.29B | 2.60B | 2.45B | 2.31B | 2.30B | 2.43B | 2.76B | 2.31B | 2.00B |
| Net Income | 11.21B | 9.27B | 16.91B | 12.23B | 12.61B | 10.14B | 7.16B | 8.53B | 9.07B | 14.46B | 10.02B | 10.23B | 9.49B | 34.23B | 10.43B | 18.04B | 10.65B | 9.20B | 8.08B | 7.03B | 6.21B | 7.56B | 6.68B | 5.76B | 4.72B | 4.21B |
| Net Income Ratio | 12.01% | 9.78% | 19.33% | 14.44% | 13.58% | 11.05% | 7.94% | 9.50% | 10.18% | 15.74% | 10.84% | 11.08% | 11.33% | 32.72% | 10.37% | 16.41% | 9.90% | 9.34% | 8.87% | 8.10% | 7.06% | 8.48% | 7.89% | 7.08% | 6.33% | 5.86% |
| EPS | 4.23 | 3.42 | 6.06 | 4.30 | 4.30 | 3.36 | 2.31 | 2.76 | 2.90 | 4.54 | 3.14 | 3.21 | 2.97 | 10.16 | 2.92 | 4.87 | 2.78 | 2.39 | 2.08 | 1.70 | 1.61 | 1.95 | 1.73 | 1.49 | 6.11 | 5.35 |
| EPS Diluted | 4.23 | 3.42 | 6.06 | 4.29 | 4.30 | 3.36 | 2.31 | 2.75 | 2.89 | 4.52 | 3.13 | 3.20 | 2.96 | 10.12 | 2.91 | 4.84 | 2.76 | 2.38 | 2.06 | 1.67 | 1.59 | 1.93 | 1.71 | 1.48 | 6.04 | 5.30 |
| Weighted Avg Shares Out | 2.65B | 2.71B | 2.79B | 2.85B | 2.93B | 3.01B | 3.09B | 3.09B | 3.13B | 3.19B | 3.19B | 3.19B | 3.20B | 3.37B | 3.57B | 3.70B | 3.83B | 3.85B | 3.89B | 3.88B | 3.87B | 3.88B | 3.87B | 8.07B | 8.07B | 8.07B |
| Weighted Avg Shares Out (Dil) | 2.65B | 2.71B | 2.79B | 2.85B | 2.93B | 3.02B | 3.10B | 3.10B | 3.14B | 3.20B | 3.20B | 3.20B | 3.21B | 3.38B | 3.58B | 3.73B | 3.87B | 3.89B | 4.00B | 4.04B | 4.04B | 4.04B | 3.90B | 8.07B | 8.07B | 8.07B |

Nestle launches 'Ozempic face' range as sales of weight-loss drugs soar

Seres to sell bacterial infection drug to Nestle Health for an undisclosed sum

Nestlé Health Science agrees to acquire global rights to VOWST®, product it launched in June 2023
Nutritional needs are 'shifting' amid rise of weight loss drugs, says Nestle CEO
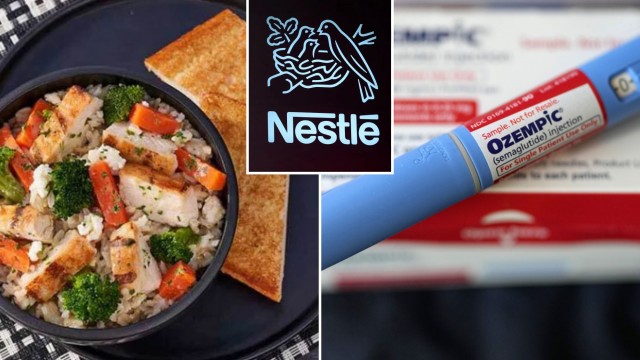
Nestlé launches food line targeting Ozempic, other weight-loss drug users
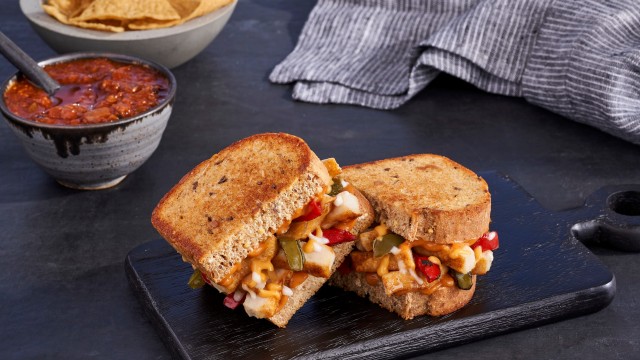
Ozempic users will soon get their own heat-and-eat meals
Nestle launches new range to tap into Wegovy surge

Nestle launches new range to tap into Wegovy surge
Nestlé Launching Frozen Food Brand For Ozempic Users
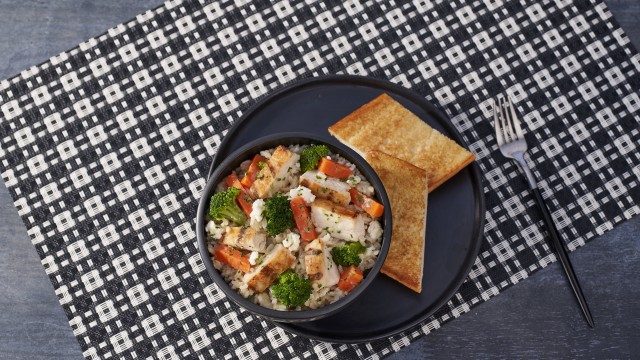
Nestle to launch Vital Pursuit frozen-food brand targeting GLP-1 users
Source: https://incomestatements.info
Category: Stock Reports
