See more : Sinch AB (publ) (SINCH.ST) Income Statement Analysis – Financial Results
Complete financial analysis of NetSol Technologies, Inc. (NTWK) income statement, including revenue, profit margins, EPS and key performance metrics. Get detailed insights into the financial performance of NetSol Technologies, Inc., a leading company in the Software – Application industry within the Technology sector.
- Invinity Energy Systems plc (IESVF) Income Statement Analysis – Financial Results
- PTT Oil and Retail Business Public Company Limited (OR.BK) Income Statement Analysis – Financial Results
- K-TOP Reits Co.,Ltd. (145270.KS) Income Statement Analysis – Financial Results
- Premier Marketing Public Company Limited (PM.BK) Income Statement Analysis – Financial Results
- Adastra Holdings Ltd. (XTRX.CN) Income Statement Analysis – Financial Results
NetSol Technologies, Inc. (NTWK)
About NetSol Technologies, Inc.
NetSol Technologies, Inc. designs, develops, markets, and exports software products to the automobile financing and leasing, banking, and financial services industries worldwide. The company offers NFS Ascent, a suite of financial applications for businesses in the finance and leasing industry. Its NFS Ascent constituent applications include Omni Point of Sale, a web-based application; Contract Management System (CMS), an application for managing and maintaining credit contracts; Wholesale Finance System (WFS), a system for automating and managing the lifecycle of wholesale finance; Dealer Auditor Access System, a web-based solution that could be used in conjunction with WFS or any third-party wholesale finance system; NFS Ascent On The Cloud, a cloud-version of NFS Ascent; and NFS Digital solutions covering Self Point of Sale, Mobile Account, Mobile Point of Sale, Mobile Dealer, Mobile Auditor, Mobile Collector, and Mobile Field Investigator. The company also provides Otoz Digital Auto-Retail, a white-labelled SaaS platform; Otoz Ecosystem, an API-based architecture; and Otoz Platform, a white label platform, which includes Dealer Tool and Customer App portals. In addition, it offers system integration, consulting, and IT products and services. It serves blue chip organizations, Dow-Jones 30 Industrials, Fortune 500 manufacturers and financial institutions, vehicle manufacturers, and enterprise technology providers. The company was incorporated in 1997 and is headquartered in Calabasas, California.
| Metric | 2024 | 2023 | 2022 | 2021 | 2020 | 2019 | 2018 | 2017 | 2016 | 2015 | 2014 | 2013 | 2012 | 2011 | 2010 | 2009 | 2008 | 2007 | 2006 | 2005 | 2004 | 2003 | 2002 | 2001 | 2000 | 1999 | 1998 |
|---|---|---|---|---|---|---|---|---|---|---|---|---|---|---|---|---|---|---|---|---|---|---|---|---|---|---|---|
| Revenue | 61.39M | 52.39M | 57.25M | 54.92M | 56.37M | 67.82M | 60.93M | 65.37M | 64.55M | 51.05M | 36.38M | 50.80M | 39.78M | 36.55M | 36.78M | 26.45M | 36.64M | 29.28M | 18.69M | 12.44M | 5.75M | 3.75M | 3.58M | 6.73M | 6.98M | 3.00M | 168.84K |
| Cost of Revenue | 32.11M | 35.48M | 33.51M | 28.57M | 29.41M | 33.37M | 31.72M | 36.96M | 33.75M | 33.02M | 27.72M | 22.95M | 18.28M | 14.80M | 13.87M | 17.20M | 15.72M | 13.66M | 9.02M | 4.75M | 2.66M | 1.78M | 2.96M | 4.13M | 2.17M | 1.30M | 133.86K |
| Gross Profit | 29.28M | 16.92M | 23.74M | 26.35M | 26.96M | 34.45M | 29.21M | 28.41M | 30.80M | 18.03M | 8.66M | 27.84M | 21.50M | 21.74M | 22.91M | 9.25M | 20.92M | 15.62M | 9.67M | 7.68M | 3.09M | 1.97M | 616.43K | 2.60M | 4.81M | 1.70M | 34.98K |
| Gross Profit Ratio | 47.70% | 32.29% | 41.46% | 47.98% | 47.83% | 50.79% | 47.93% | 43.46% | 47.72% | 35.31% | 23.81% | 54.81% | 54.05% | 59.49% | 62.30% | 34.97% | 57.09% | 53.35% | 51.74% | 61.77% | 53.79% | 52.50% | 17.23% | 38.60% | 68.86% | 56.67% | 20.72% |
| Research & Development | 1.40M | 1.60M | 1.34M | 674.17K | 1.47M | 1.97M | 854.00K | 393.35K | 485.78K | 314.89K | 249.71K | 207.90K | 0.00 | 0.00 | 0.00 | 0.00 | 0.00 | 0.00 | 0.00 | 0.00 | 0.00 | 0.00 | 0.00 | 0.00 | 0.00 | 0.00 | 0.00 |
| General & Administrative | 0.00 | 0.00 | 15.39M | 15.44M | 17.14M | 16.92M | 16.25M | 16.75M | 14.97M | 14.78M | 15.05M | 10.65M | 8.87M | 7.07M | 8.91M | 8.25M | 11.77M | 10.99M | 7.64M | 5.05M | 4.31M | 2.65M | 4.28M | 9.14M | 7.29M | 2.80M | 0.00 |
| Selling & Marketing | 0.00 | 0.00 | 7.22M | 6.56M | 6.45M | 7.83M | 7.62M | 9.75M | 7.82M | 6.09M | 4.57M | 3.56M | 3.13M | 3.02M | 2.22M | 3.12M | 0.00 | 0.00 | 0.00 | 0.00 | 0.00 | 76.14K | 168.84K | 0.00 | 0.00 | 0.00 | 0.00 |
| SG&A | 24.39M | 24.09M | 22.61M | 21.99M | 23.59M | 24.75M | 23.87M | 26.49M | 22.79M | 20.87M | 19.62M | 14.21M | 12.00M | 10.08M | 11.13M | 11.37M | 11.77M | 10.99M | 7.64M | 5.05M | 4.31M | 2.65M | 4.28M | 9.14M | 7.29M | 2.80M | 0.00 |
| Other Expenses | 0.00 | -605.57K | 863.18K | 965.63K | 834.58K | 897.80K | 42.85K | 50.38K | 224.93K | 684.03K | 50.58K | 147.15K | 1.24M | 1.55M | 2.05M | 4.37M | 1.94M | 1.99M | 2.29M | 1.56M | 1.71M | 1.58M | -10.06M | 8.94M | 1.41M | 400.00K | 620.45K |
| Operating Expenses | 25.79M | 25.70M | 24.82M | 23.63M | 25.89M | 27.62M | 26.15M | 29.41M | 24.50M | 23.19M | 21.75M | 15.76M | 13.24M | 11.63M | 13.19M | 15.73M | 13.71M | 12.98M | 9.93M | 6.62M | 6.03M | 4.23M | -5.78M | 18.08M | 8.70M | 3.20M | 620.45K |
| Cost & Expenses | 57.90M | 61.17M | 58.33M | 52.20M | 55.30M | 60.99M | 57.88M | 66.37M | 58.25M | 56.21M | 49.47M | 38.71M | 31.52M | 26.44M | 27.05M | 32.93M | 29.43M | 26.64M | 18.95M | 11.37M | 8.68M | 6.01M | -2.82M | 22.21M | 10.88M | 4.50M | 754.31K |
| Interest Income | 1.91M | 1.22M | 1.66M | 1.02M | 1.57M | 955.06K | 592.15K | 179.72K | 161.79K | 331.43K | 261.25K | 185.34K | 82.04K | 154.86K | 261.30K | 291.03K | 195.10K | 0.00 | 0.00 | 0.00 | 0.00 | 0.00 | 0.00 | 0.00 | 0.00 | 0.00 | 0.00 |
| Interest Expense | 1.14M | 765.03K | 369.80K | 394.29K | 346.86K | 311.80K | 422.33K | 310.04K | 264.51K | 166.96K | 255.68K | 664.03K | 823.68K | 863.71K | 1.48M | 1.29M | 626.71K | 0.00 | 0.00 | 0.00 | 0.00 | 0.00 | 0.00 | 0.00 | 0.00 | 0.00 | 0.00 |
| Depreciation & Amortization | 1.72M | 3.24M | 3.81M | 3.96M | 3.73M | 4.42M | 5.57M | 6.56M | 7.15M | 10.34M | 8.73M | 5.70M | 4.64M | 4.29M | 3.91M | 4.19M | 3.34M | 5.46M | 3.12M | 1.98M | 2.07M | 1.58M | 2.12M | 1.51M | 1.41M | 400.00K | 1.81K |
| EBITDA | 6.09M | 791.66K | 2.73M | 6.68M | 4.80M | 11.25M | 8.63M | 6.07M | 13.45M | 5.68M | -4.77M | 19.56M | 12.17M | 14.98M | 11.73M | -616.99K | 14.12M | 8.10M | 2.86M | 3.04M | -729.00K | -688.60K | -3.66M | -13.97M | -1.76M | -1.46M | -583.67K |
| EBITDA Ratio | 9.92% | -11.37% | 3.75% | 15.35% | 10.63% | 16.79% | 14.77% | 8.86% | 21.44% | 12.13% | -12.62% | 35.37% | 31.88% | 39.22% | 36.99% | -7.58% | 19.57% | 35.69% | 14.62% | 24.99% | -12.68% | -12.65% | 244.00% | -98.33% | -39.01% | -40.00% | -345.70% |
| Operating Income | 3.49M | -8.78M | -1.66M | 4.47M | 2.26M | 6.83M | 3.05M | -1.00M | 6.30M | -5.17M | -13.09M | 11.67M | 7.26M | 10.16M | 9.73M | -6.48M | 7.21M | 2.65M | -259.35K | 1.06M | -2.94M | -2.27M | 6.40M | -15.48M | -3.89M | -1.50M | -585.48K |
| Operating Income Ratio | 5.69% | -16.76% | -2.90% | 8.14% | 4.01% | 10.07% | 5.01% | -1.53% | 9.76% | -10.12% | -35.98% | 22.97% | 18.26% | 27.81% | 26.45% | -24.51% | 19.67% | 9.04% | -1.39% | 8.56% | -51.06% | -60.49% | 178.74% | -230.12% | -55.73% | -50.00% | -346.78% |
| Total Other Income/Expenses | -270.11K | 5.56M | 3.17M | 567.40K | 1.26M | 6.25M | 4.97M | 196.73K | -592.01K | 330.13K | -668.36K | 886.38K | -559.93K | -341.31K | -3.39M | 343.40K | 2.94M | -7.36M | -33.57K | -279.89K | -363.02K | 127.99K | -6.40M | 70.91K | -43.51K | 431.24K | 0.00 |
| Income Before Tax | 3.22M | -3.22M | 2.09M | 3.29M | 2.33M | 13.08M | 8.02M | -804.49K | 5.71M | -4.84M | -13.76M | 12.55M | 6.70M | 9.82M | 6.34M | -6.14M | 7.34M | -4.72M | -1.25M | 673.74K | -3.07M | -2.14M | -6.00M | -15.41M | -3.65M | -1.40M | 0.00 |
| Income Before Tax Ratio | 5.25% | -6.14% | 3.65% | 5.99% | 4.14% | 19.28% | 13.17% | -1.23% | 8.85% | -9.47% | -37.81% | 24.71% | 16.86% | 26.88% | 17.24% | -23.21% | 20.04% | -16.11% | -6.67% | 5.42% | -53.42% | -57.07% | -167.65% | -229.07% | -52.27% | -46.67% | 0.00% |
| Income Tax Expense | 1.15M | 926.56K | 988.94K | 1.03M | 1.14M | 1.06M | 873.03K | 931.95K | 652.55K | 413.50K | 338.28K | 465.43K | 55.38K | 120.54K | 53.94K | 91.13K | 121.98K | 160.31K | 106.02K | 10.42K | 34.61K | -127.99K | 12.39M | -2.85M | -250.00K | 100.00K | 0.00 |
| Net Income | 683.87K | -5.24M | 1.10M | 1.78M | 937.08K | 12.02M | 4.31M | -4.98M | 3.40M | -5.55M | -11.36M | 7.86M | 2.45M | 5.73M | 1.39M | -8.05M | 7.22M | -4.88M | -1.35M | 663.33K | -2.97M | -2.14M | -6.00M | -14.05M | -3.40M | -1.60M | -585.48K |
| Net Income Ratio | 1.11% | -10.01% | 1.92% | 3.24% | 1.66% | 17.72% | 7.07% | -7.62% | 5.27% | -10.87% | -31.21% | 15.48% | 6.15% | 15.67% | 3.79% | -30.43% | 19.71% | -16.66% | -7.24% | 5.33% | -51.66% | -57.07% | -167.65% | -208.86% | -48.69% | -53.33% | -346.78% |
| EPS | 0.06 | -0.46 | 0.10 | 0.15 | 0.08 | 1.04 | 0.38 | -0.46 | 0.33 | -0.57 | -1.25 | 0.96 | 0.39 | 1.18 | 0.40 | -2.99 | 2.00 | -2.68 | -0.93 | 0.60 | -3.77 | -4.74 | -19.96 | -62.57 | -17.59 | -18.56 | -16.50 |
| EPS Diluted | 0.06 | -0.46 | 0.10 | 0.15 | 0.08 | 1.03 | 0.38 | -0.46 | 0.32 | -0.57 | -1.25 | 0.96 | 0.39 | 1.16 | 0.40 | -2.98 | 1.90 | -2.68 | -0.93 | 0.40 | -3.77 | -4.74 | -19.96 | -62.57 | -17.59 | -18.56 | -12.78 |
| Weighted Avg Shares Out | 11.38M | 11.28M | 11.25M | 11.50M | 11.73M | 11.60M | 11.20M | 10.82M | 10.39M | 9.73M | 9.06M | 8.20M | 6.22M | 4.85M | 3.45M | 2.69M | 2.41M | 1.82M | 1.46M | 1.16M | 788.16K | 451.22K | 300.60K | 224.53K | 193.32K | 86.18K | 35.48K |
| Weighted Avg Shares Out (Dil) | 11.42M | 11.28M | 11.25M | 11.50M | 11.78M | 11.62M | 11.20M | 10.91M | 10.58M | 9.73M | 9.06M | 8.29M | 6.24M | 4.96M | 3.78M | 2.70M | 2.60M | 1.82M | 1.46M | 1.48M | 788.16K | 451.22K | 300.60K | 224.53K | 193.32K | 86.18K | 45.82K |
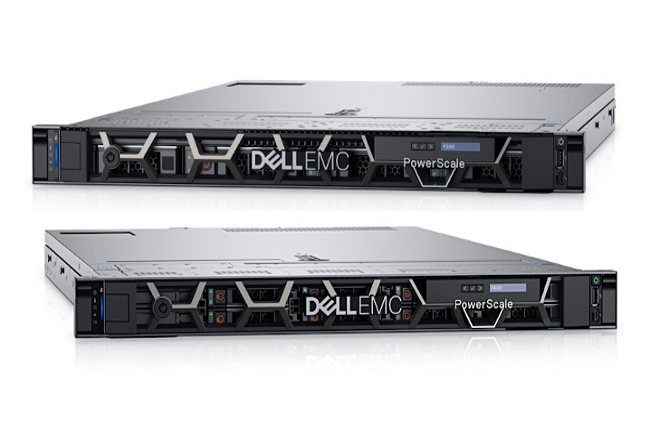
Dell EMC PowerScale wants to conquer all your unstructured data
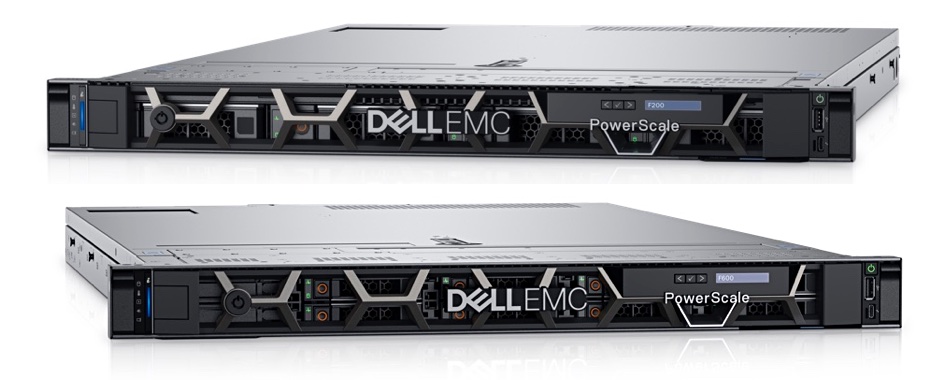
Dell updates Isilon with PowerScale label, fresh hardware and other tweaks – Blocks and Files
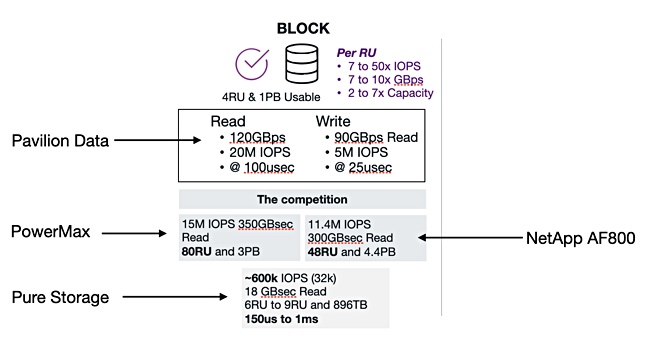
Pavilion Data: Our storage array is considerably better than yours – Blocks and Files

Scality’s Zenko cloud data controller gains data moving feature – Blocks and Files
Data Center Infrastructure And Transport

NetApp loves Iguazio's AI pipeline software – Blocks and Files

Pure Storage delivers Purity six appeal – Blocks and Files

How Need For Speed Can Compete With Forza
Source: https://incomestatements.info
Category: Stock Reports

