See more : NuStar Energy L.P. (NS) Income Statement Analysis – Financial Results
Complete financial analysis of Nuveen Municipal Value Fund, Inc. (NUV) income statement, including revenue, profit margins, EPS and key performance metrics. Get detailed insights into the financial performance of Nuveen Municipal Value Fund, Inc., a leading company in the Asset Management industry within the Financial Services sector.
- Silver Viper Minerals Corp. (VIPRF) Income Statement Analysis – Financial Results
- PageGroup plc (PAGE.L) Income Statement Analysis – Financial Results
- Dynatrace, Inc. (DT) Income Statement Analysis – Financial Results
- Grupo Hotelero Santa Fe, S.A.B. de C.V. (HOTEL.MX) Income Statement Analysis – Financial Results
- Fielmann Aktiengesellschaft (FLMNF) Income Statement Analysis – Financial Results
Nuveen Municipal Value Fund, Inc. (NUV)
Industry: Asset Management
Sector: Financial Services
Website: https://www.nuveen.com/CEF/Product/Overview.aspx?FundCode=NUV&refsrc=vu_nuveen.com/nuv
About Nuveen Municipal Value Fund, Inc.
Nuveen Municipal Value Fund, Inc. is a closed-ended fixed income mutual fund launched by Nuveen Investments, Inc. The fund is co-managed by Nuveen Fund Advisors LLC and Nuveen Asset Management, LLC. It invests in the fixed income markets of the United States. The fund also invests some portion of its portfolio in derivative instruments. It invests in undervalued municipal securities and other related investments the income, exempt from regular federal income taxes that are rated Baa or BBB or better. It employs fundamental analysis with bottom-up stock picking approach to create its portfolio. The fund benchmarks the performance of its portfolio against the Standard & Poor's (S&P) National Municipal Bond Index. Nuveen Municipal Value Fund, Inc. was formed on April 8, 1987 and is domiciled in the United States.
| Metric | 2023 | 2022 | 2021 | 2020 | 2019 | 2018 | 2017 | 2016 | 2015 | 2014 | 2013 | 2012 | 2010 |
|---|---|---|---|---|---|---|---|---|---|---|---|---|---|
| Revenue | 82.25M | -313.30M | 103.08M | 60.17M | 229.90M | -13.06M | 61.98M | 85.31M | 96.38M | 99.87M | 101.25M | 105.32M | 0.00 |
| Cost of Revenue | 0.00 | 9.58M | 10.28M | 10.30M | 10.43M | 10.32M | 10.43M | 10.46M | 0.00 | 0.00 | 0.00 | 0.00 | 0.00 |
| Gross Profit | 82.25M | -322.88M | 92.80M | 49.87M | 219.47M | -23.38M | 51.55M | 74.85M | 96.38M | 99.87M | 101.25M | 105.32M | 0.00 |
| Gross Profit Ratio | 100.00% | 103.06% | 90.03% | 82.88% | 95.46% | 179.05% | 83.17% | 87.74% | 100.00% | 100.00% | 100.00% | 100.00% | 0.00% |
| Research & Development | 0.00 | -8.78 | 1.13 | 0.68 | 2.51 | -0.16 | 0.57 | 1.42 | 0.00 | 0.00 | 0.00 | 0.00 | 0.00 |
| General & Administrative | 9.45M | 713.56K | 716.20K | 801.47K | 841.20K | 804.00K | 988.68K | 10.93M | 10.92M | 11.29M | 11.32M | 11.29M | 0.00 |
| Selling & Marketing | 0.00 | 0.00 | 0.00 | 0.00 | 0.00 | 0.00 | 0.00 | -10.93M | 0.00 | 0.00 | 0.00 | 0.00 | 0.00 |
| SG&A | 9.45M | 713.56K | 716.20K | 801.47K | 841.20K | 804.00K | 988.68K | 1.42 | 10.92M | 11.29M | 11.32M | 11.29M | 0.00 |
| Other Expenses | 0.00 | 316.11K | 348.20K | 327.18K | 394.24K | 387.13K | 251.29K | 206.88M | 0.00 | 0.00 | 0.00 | 0.00 | 0.00 |
| Operating Expenses | 9.45M | 1.03M | 1.06M | 1.13M | 1.24M | 1.19M | 1.24M | 27.25M | 15.63M | 114.16M | 153.95M | 132.96M | 0.00 |
| Cost & Expenses | 9.45M | 1.03M | 1.06M | 1.13M | 1.24M | 1.19M | 1.24M | 74.85M | 15.63M | 114.16M | 153.95M | 132.96M | 0.00 |
| Interest Income | 82.25M | 296.98K | 176.20K | 356.07K | 748.00K | 0.00 | 0.00 | 150.87K | 79.54K | 105.89K | 96.83K | 305.55K | 0.00 |
| Interest Expense | 791.58K | 296.98K | 176.20K | 356.07K | 748.00K | 687.69K | 153.49K | 0.00 | 0.00 | 0.00 | 0.00 | 0.00 | 0.00 |
| Depreciation & Amortization | -72.79M | -68.68M | -72.95M | -76.83M | -78.05M | -79.17M | -81.98M | -83.45M | -85.46M | -88.57M | -89.94M | -94.03M | 0.00 |
| EBITDA | -17.06M | -314.04M | 0.00 | 0.00 | 0.00 | -13.56M | 0.00 | 0.00 | 0.00 | 0.00 | 0.00 | 143.94M | 0.00 |
| EBITDA Ratio | -20.75% | 100.23% | 98.97% | 98.12% | 99.46% | 103.86% | 98.25% | -42.39% | -4.97% | 125.51% | -140.97% | 136.67% | 0.00% |
| Operating Income | 72.79M | -314.04M | 102.01M | 59.05M | 228.66M | -13.56M | 60.89M | 83.45M | 85.46M | 88.57M | 89.94M | 94.03M | 0.00 |
| Operating Income Ratio | 88.51% | 100.23% | 98.97% | 98.12% | 99.46% | 103.86% | 98.25% | 97.81% | 88.67% | 88.69% | 88.82% | 89.28% | 0.00% |
| Total Other Income/Expenses | -17.86M | 9.58M | 0.00 | 0.00 | 0.00 | 10.32M | -21.24M | 38.04M | -4.79M | 125.34M | -142.73M | 143.94M | 0.00 |
| Income Before Tax | 54.94M | -314.33M | 102.01M | 59.05M | 228.66M | -14.25M | 60.74M | 121.48M | 80.67M | 213.92M | -52.80M | 237.97M | 0.00 |
| Income Before Tax Ratio | 66.80% | 100.33% | 98.97% | 98.12% | 99.46% | 109.12% | 98.00% | 142.39% | 83.70% | 214.20% | -52.14% | 225.95% | 0.00% |
| Income Tax Expense | 0.00 | 68.68M | 102.01M | 76.47M | 77.31M | -161.14K | 81.98M | -74.35M | -4.79M | 125.34M | -142.73M | 143.94M | 0.00 |
| Net Income | 54.94M | -314.33M | 102.01M | 59.05M | 228.66M | -14.25M | 60.74M | 121.63M | 80.67M | 213.92M | -52.80M | 237.97M | 0.00 |
| Net Income Ratio | 66.80% | 100.33% | 98.97% | 98.12% | 99.46% | 109.12% | 98.00% | 142.57% | 83.70% | 214.20% | -52.14% | 225.95% | 0.00% |
| EPS | 0.26 | -1.51 | 0.50 | 0.29 | 1.11 | -0.07 | 0.30 | 1.00 | 0.39 | 1.04 | -0.26 | 1.17 | 0.00 |
| EPS Diluted | 0.26 | -1.51 | 0.50 | 0.29 | 1.11 | -0.07 | 0.30 | 207.14M | 0.39 | 1.04 | -0.26 | 1.17 | 0.00 |
| Weighted Avg Shares Out | 207.54M | 207.54M | 204.02M | 207.08M | 206.88M | 203.54M | 202.46M | 121.48M | 205.63M | 205.63M | 205.63M | 204.22M | 197.88M |
| Weighted Avg Shares Out (Dil) | 207.54M | 207.54M | 204.02M | 207.08M | 206.88M | 203.54M | 202.46M | 0.59 | 205.63M | 205.63M | 205.63M | 204.22M | 197.88M |

Nuveen Closed-End Funds Declare Distributions and Updates to Distribution Policies

NUV: Investment-Grade Municipal Exposure With Little Leverage

IIM Vs. NUV: Invesco And Nuveen Value Municipal CEFs Compared

Weekly Closed-End Fund Roundup: PCF, RIV Rights Offering Results, Guggenheim Mergers Completed (November 14, 2021)

CEF Weekly Market Review: Funds Take A Breather

Rotation Choices For Expensive Muni CEFs

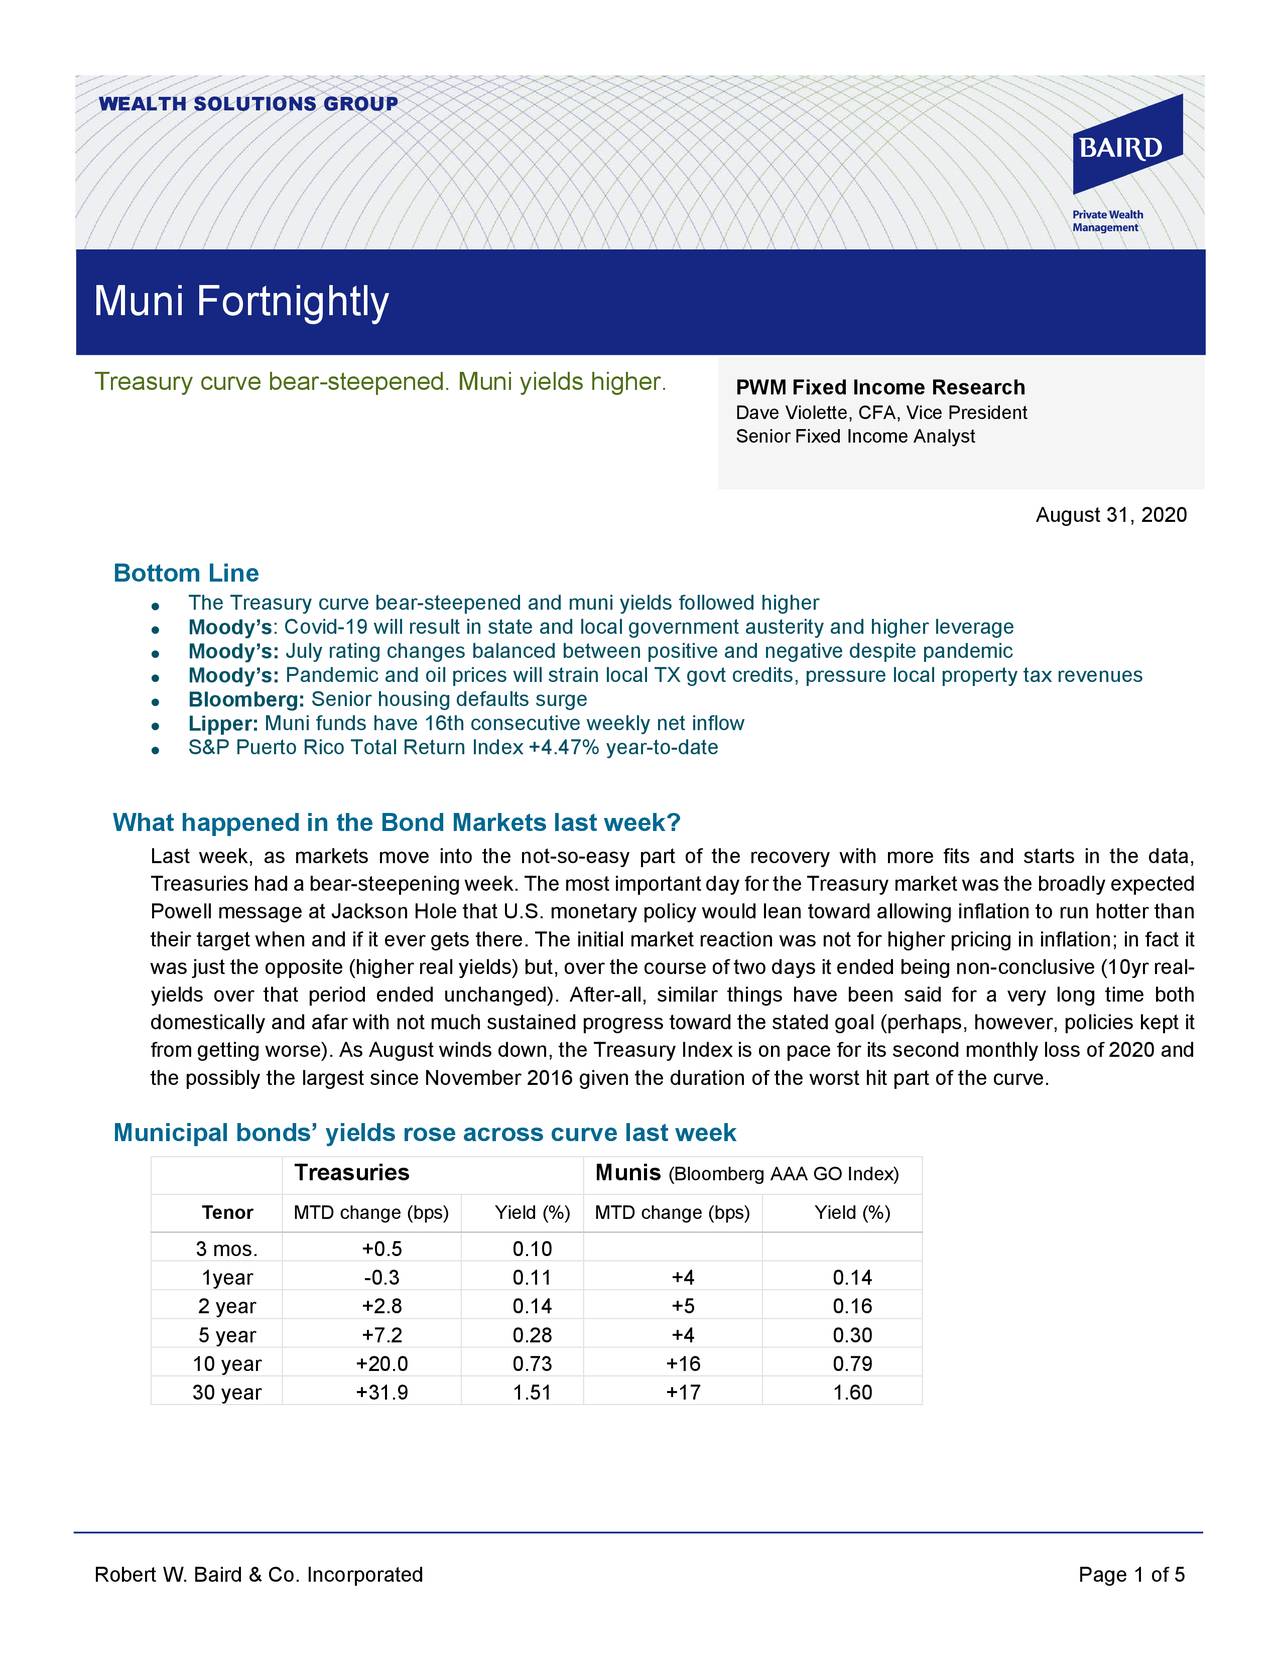
Treasury Curve Bear-Steepened; Muni Yields Higher - Muni Fortnightly, August 31, 2020

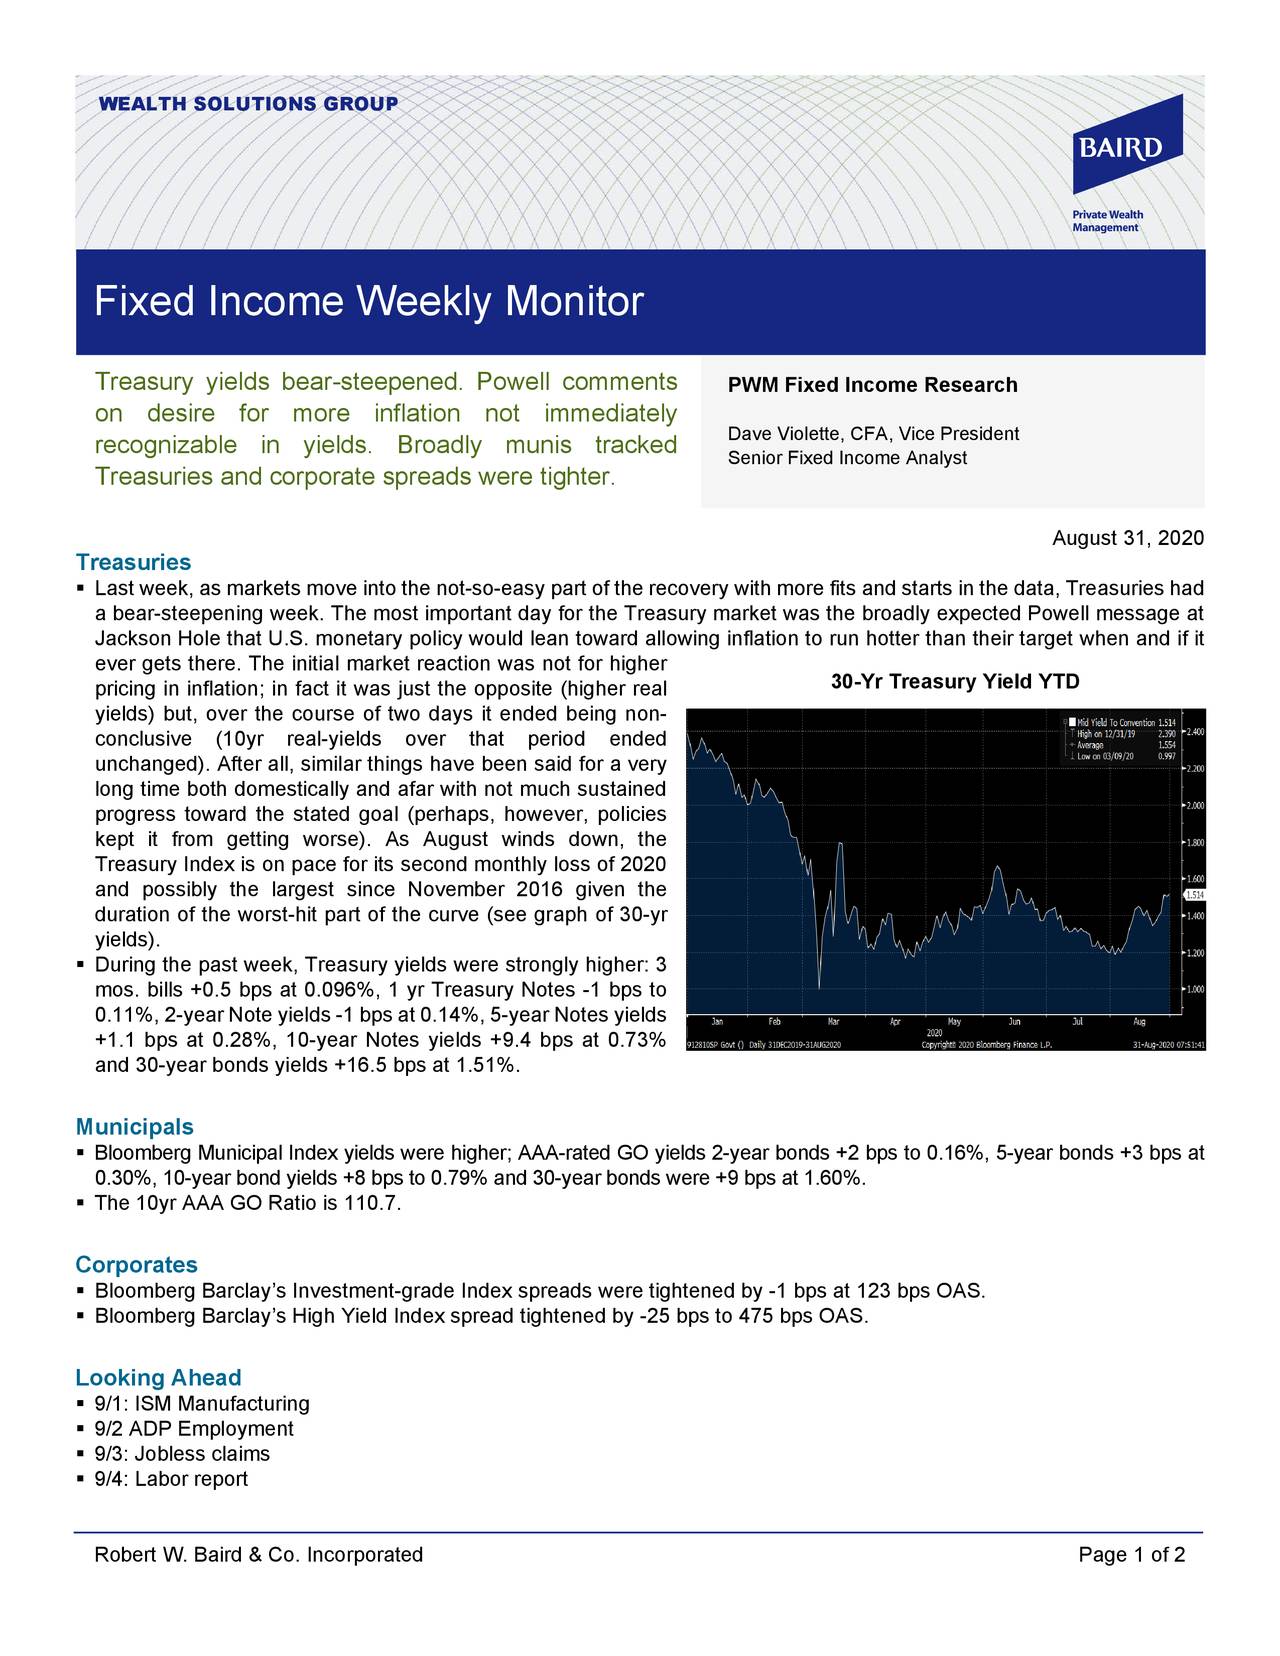
Treasuries Had A Bear-Steepening Week: Fixed Income Weekly Monitor, August 31, 2020

Rule #1 For Bonds: Don't Lose Money

For Muni Investors, COVID-19 Provides Lessons In Liquidity
Source: https://incomestatements.info
Category: Stock Reports
