See more : Shanghai Sinotec (Group) Co., Ltd. (603121.SS) Income Statement Analysis – Financial Results
Complete financial analysis of Nuveen Municipal Value Fund, Inc. (NUV) income statement, including revenue, profit margins, EPS and key performance metrics. Get detailed insights into the financial performance of Nuveen Municipal Value Fund, Inc., a leading company in the Asset Management industry within the Financial Services sector.
- Sun Art Retail Group Limited (SURRY) Income Statement Analysis – Financial Results
- Oakridge International Limited (OAK.AX) Income Statement Analysis – Financial Results
- FitLife Brands, Inc. (FTLF) Income Statement Analysis – Financial Results
- Kwong Luen Engineering Holdings Limited (1413.HK) Income Statement Analysis – Financial Results
- Portmeirion Group PLC (PMP.L) Income Statement Analysis – Financial Results
Nuveen Municipal Value Fund, Inc. (NUV)
Industry: Asset Management
Sector: Financial Services
Website: https://www.nuveen.com/CEF/Product/Overview.aspx?FundCode=NUV&refsrc=vu_nuveen.com/nuv
About Nuveen Municipal Value Fund, Inc.
Nuveen Municipal Value Fund, Inc. is a closed-ended fixed income mutual fund launched by Nuveen Investments, Inc. The fund is co-managed by Nuveen Fund Advisors LLC and Nuveen Asset Management, LLC. It invests in the fixed income markets of the United States. The fund also invests some portion of its portfolio in derivative instruments. It invests in undervalued municipal securities and other related investments the income, exempt from regular federal income taxes that are rated Baa or BBB or better. It employs fundamental analysis with bottom-up stock picking approach to create its portfolio. The fund benchmarks the performance of its portfolio against the Standard & Poor's (S&P) National Municipal Bond Index. Nuveen Municipal Value Fund, Inc. was formed on April 8, 1987 and is domiciled in the United States.
| Metric | 2023 | 2022 | 2021 | 2020 | 2019 | 2018 | 2017 | 2016 | 2015 | 2014 | 2013 | 2012 | 2010 |
|---|---|---|---|---|---|---|---|---|---|---|---|---|---|
| Revenue | 82.25M | -313.30M | 103.08M | 60.17M | 229.90M | -13.06M | 61.98M | 85.31M | 96.38M | 99.87M | 101.25M | 105.32M | 0.00 |
| Cost of Revenue | 0.00 | 9.58M | 10.28M | 10.30M | 10.43M | 10.32M | 10.43M | 10.46M | 0.00 | 0.00 | 0.00 | 0.00 | 0.00 |
| Gross Profit | 82.25M | -322.88M | 92.80M | 49.87M | 219.47M | -23.38M | 51.55M | 74.85M | 96.38M | 99.87M | 101.25M | 105.32M | 0.00 |
| Gross Profit Ratio | 100.00% | 103.06% | 90.03% | 82.88% | 95.46% | 179.05% | 83.17% | 87.74% | 100.00% | 100.00% | 100.00% | 100.00% | 0.00% |
| Research & Development | 0.00 | -8.78 | 1.13 | 0.68 | 2.51 | -0.16 | 0.57 | 1.42 | 0.00 | 0.00 | 0.00 | 0.00 | 0.00 |
| General & Administrative | 9.45M | 713.56K | 716.20K | 801.47K | 841.20K | 804.00K | 988.68K | 10.93M | 10.92M | 11.29M | 11.32M | 11.29M | 0.00 |
| Selling & Marketing | 0.00 | 0.00 | 0.00 | 0.00 | 0.00 | 0.00 | 0.00 | -10.93M | 0.00 | 0.00 | 0.00 | 0.00 | 0.00 |
| SG&A | 9.45M | 713.56K | 716.20K | 801.47K | 841.20K | 804.00K | 988.68K | 1.42 | 10.92M | 11.29M | 11.32M | 11.29M | 0.00 |
| Other Expenses | 0.00 | 316.11K | 348.20K | 327.18K | 394.24K | 387.13K | 251.29K | 206.88M | 0.00 | 0.00 | 0.00 | 0.00 | 0.00 |
| Operating Expenses | 9.45M | 1.03M | 1.06M | 1.13M | 1.24M | 1.19M | 1.24M | 27.25M | 15.63M | 114.16M | 153.95M | 132.96M | 0.00 |
| Cost & Expenses | 9.45M | 1.03M | 1.06M | 1.13M | 1.24M | 1.19M | 1.24M | 74.85M | 15.63M | 114.16M | 153.95M | 132.96M | 0.00 |
| Interest Income | 82.25M | 296.98K | 176.20K | 356.07K | 748.00K | 0.00 | 0.00 | 150.87K | 79.54K | 105.89K | 96.83K | 305.55K | 0.00 |
| Interest Expense | 791.58K | 296.98K | 176.20K | 356.07K | 748.00K | 687.69K | 153.49K | 0.00 | 0.00 | 0.00 | 0.00 | 0.00 | 0.00 |
| Depreciation & Amortization | -72.79M | -68.68M | -72.95M | -76.83M | -78.05M | -79.17M | -81.98M | -83.45M | -85.46M | -88.57M | -89.94M | -94.03M | 0.00 |
| EBITDA | -17.06M | -314.04M | 0.00 | 0.00 | 0.00 | -13.56M | 0.00 | 0.00 | 0.00 | 0.00 | 0.00 | 143.94M | 0.00 |
| EBITDA Ratio | -20.75% | 100.23% | 98.97% | 98.12% | 99.46% | 103.86% | 98.25% | -42.39% | -4.97% | 125.51% | -140.97% | 136.67% | 0.00% |
| Operating Income | 72.79M | -314.04M | 102.01M | 59.05M | 228.66M | -13.56M | 60.89M | 83.45M | 85.46M | 88.57M | 89.94M | 94.03M | 0.00 |
| Operating Income Ratio | 88.51% | 100.23% | 98.97% | 98.12% | 99.46% | 103.86% | 98.25% | 97.81% | 88.67% | 88.69% | 88.82% | 89.28% | 0.00% |
| Total Other Income/Expenses | -17.86M | 9.58M | 0.00 | 0.00 | 0.00 | 10.32M | -21.24M | 38.04M | -4.79M | 125.34M | -142.73M | 143.94M | 0.00 |
| Income Before Tax | 54.94M | -314.33M | 102.01M | 59.05M | 228.66M | -14.25M | 60.74M | 121.48M | 80.67M | 213.92M | -52.80M | 237.97M | 0.00 |
| Income Before Tax Ratio | 66.80% | 100.33% | 98.97% | 98.12% | 99.46% | 109.12% | 98.00% | 142.39% | 83.70% | 214.20% | -52.14% | 225.95% | 0.00% |
| Income Tax Expense | 0.00 | 68.68M | 102.01M | 76.47M | 77.31M | -161.14K | 81.98M | -74.35M | -4.79M | 125.34M | -142.73M | 143.94M | 0.00 |
| Net Income | 54.94M | -314.33M | 102.01M | 59.05M | 228.66M | -14.25M | 60.74M | 121.63M | 80.67M | 213.92M | -52.80M | 237.97M | 0.00 |
| Net Income Ratio | 66.80% | 100.33% | 98.97% | 98.12% | 99.46% | 109.12% | 98.00% | 142.57% | 83.70% | 214.20% | -52.14% | 225.95% | 0.00% |
| EPS | 0.26 | -1.51 | 0.50 | 0.29 | 1.11 | -0.07 | 0.30 | 1.00 | 0.39 | 1.04 | -0.26 | 1.17 | 0.00 |
| EPS Diluted | 0.26 | -1.51 | 0.50 | 0.29 | 1.11 | -0.07 | 0.30 | 207.14M | 0.39 | 1.04 | -0.26 | 1.17 | 0.00 |
| Weighted Avg Shares Out | 207.54M | 207.54M | 204.02M | 207.08M | 206.88M | 203.54M | 202.46M | 121.48M | 205.63M | 205.63M | 205.63M | 204.22M | 197.88M |
| Weighted Avg Shares Out (Dil) | 207.54M | 207.54M | 204.02M | 207.08M | 206.88M | 203.54M | 202.46M | 0.59 | 205.63M | 205.63M | 205.63M | 204.22M | 197.88M |

Are Your Munis Stuck In A Pre-2008 World?

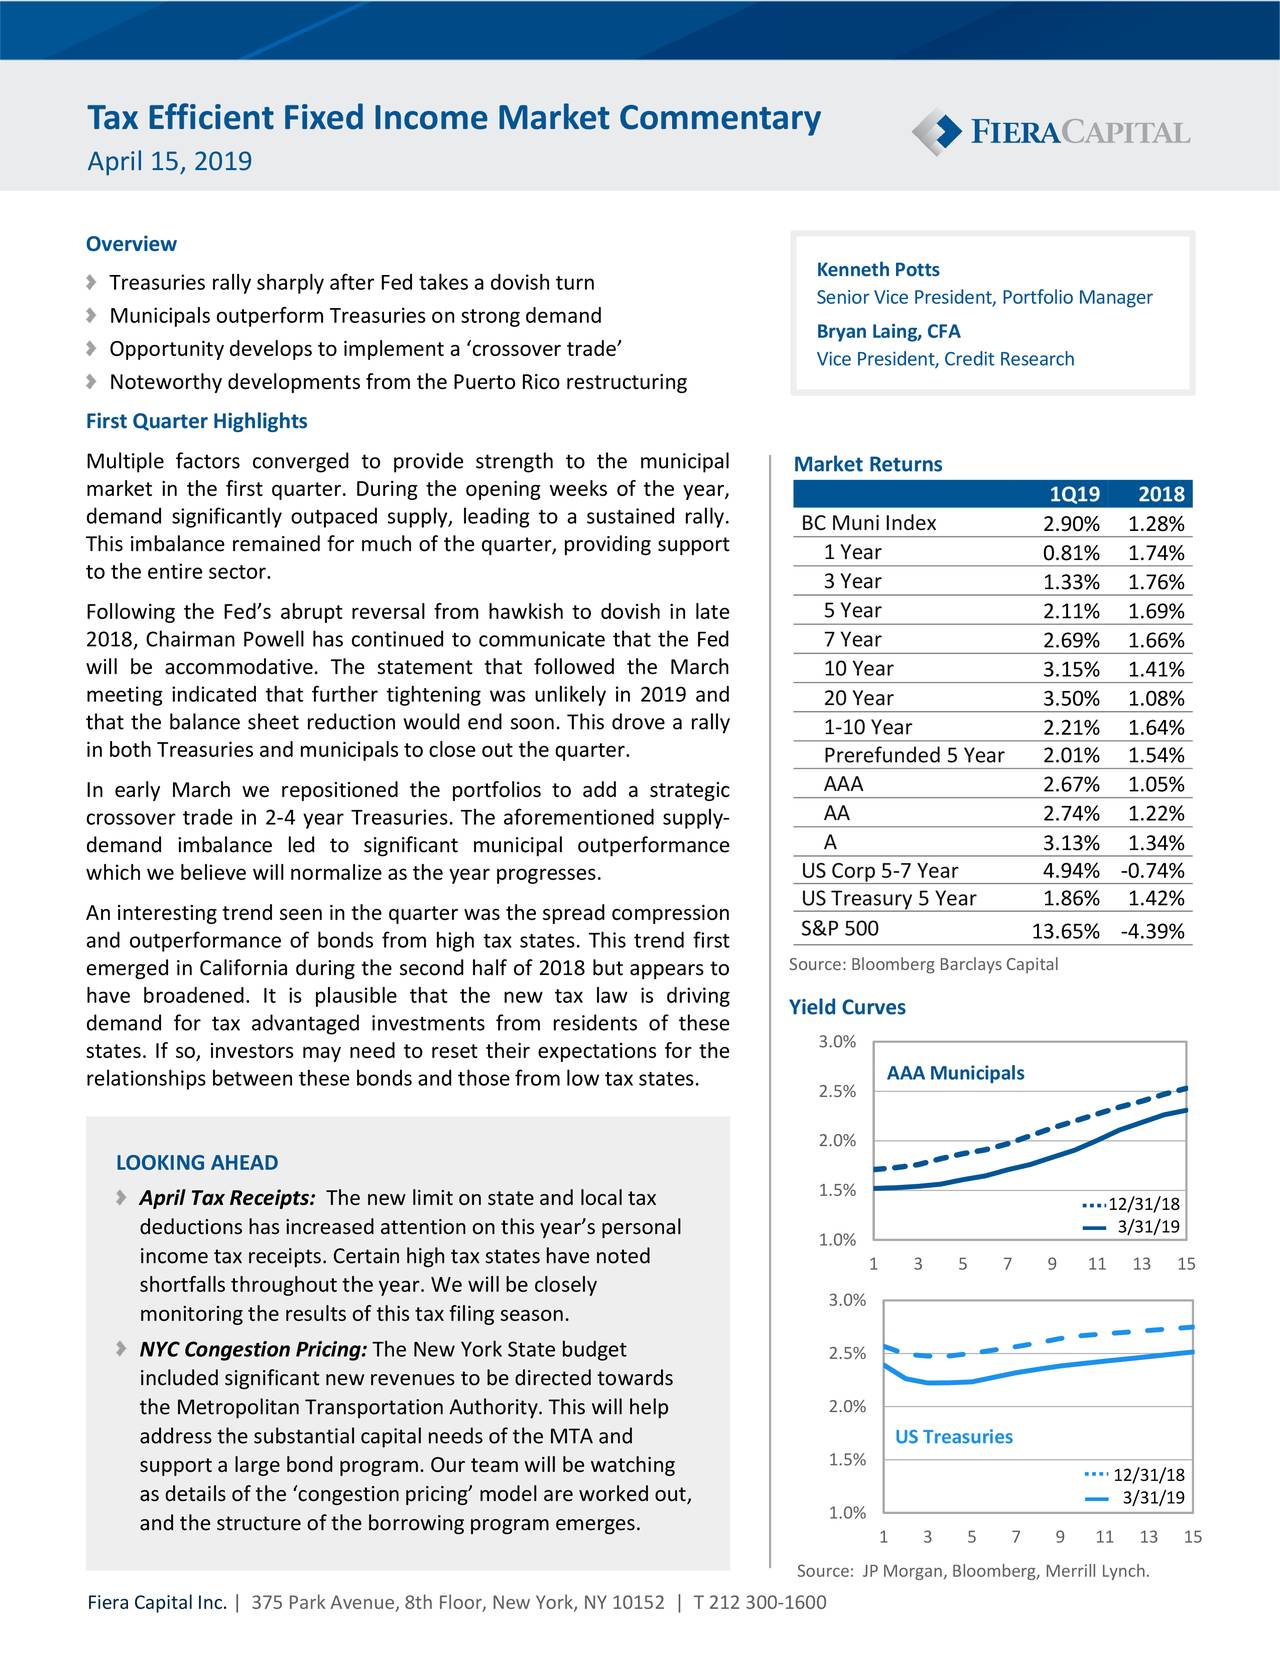
Q1 2019 Credit Commentary

Fiera Capital Tax-Efficient Fixed Income 1st Quarter Market Commentary
Source: https://incomestatements.info
Category: Stock Reports
