See more : Cargotec Corporation (0MGH.L) Income Statement Analysis – Financial Results
Complete financial analysis of Public Joint Stock Company Gazprom (OGZPY) income statement, including revenue, profit margins, EPS and key performance metrics. Get detailed insights into the financial performance of Public Joint Stock Company Gazprom, a leading company in the Oil & Gas Integrated industry within the Energy sector.
- GreenLight Biosciences Holdings (GRNAW) Income Statement Analysis – Financial Results
- Western Uranium & Vanadium Corp. (WUC.CN) Income Statement Analysis – Financial Results
- Public Joint Stock Company Mining and Metallurgical Company Norilsk Nickel (GMKN.ME) Income Statement Analysis – Financial Results
- Acelyrin, Inc. (SLRN) Income Statement Analysis – Financial Results
- Outset Medical, Inc. (OM) Income Statement Analysis – Financial Results
Public Joint Stock Company Gazprom (OGZPY)
About Public Joint Stock Company Gazprom
Public Joint Stock Company Gazprom, an integrated energy company, engages in the geological exploration, production, processing, storage, transportation, and sale of gas, gas condensates, and oil in Russia and internationally. The company operates through Production of Gas, Transportation of Gas, Distribution of Gas, Gas Storage, Production of Crude Oil and Gas Condensate, Refining, and Electric and Heat Energy Generation and Sales segments. It also produces coalbed methane; and owns Unified Gas Supply System, a gas transmission system totaling approximately 175.2 kilometers that comprises 254 compressor stations with a total capacity of 46.8 megawatts in Russia. In addition, the company operates underground gas storage facilities; operates oil refining and petrochemical complexes; generates and sells electric and heat energy; produces crude oil and gas condensate; and produces other goods, as well as provides other works and rendering of other services. Further, it offers oil, gas condensate, and other hydrocarbons; and sells refined products. Public Joint Stock Company Gazprom was founded in 1993 and is headquartered in Moscow, Russia.
| Metric | 2021 | 2020 | 2019 | 2018 | 2017 | 2016 | 2015 | 2014 | 2013 | 2012 | 2011 | 2010 | 2009 | 2008 | 2007 | 2006 | 2005 | 2004 |
|---|---|---|---|---|---|---|---|---|---|---|---|---|---|---|---|---|---|---|
| Revenue | 10,241.35B | 6,321.56B | 7,659.62B | 8,224.18B | 6,546.14B | 6,111.05B | 6,073.32B | 5,589.81B | 5,249.97B | 4,764.41B | 4,637.09B | 3,597.05B | 2,991.00B | 3,285.49B | 2,423.24B | 2,204.89B | 1,383.55B | 976.78B |
| Cost of Revenue | 0.00 | 3,021.12B | 3,309.38B | 3,351.04B | 2,890.87B | 2,909.45B | 2,560.72B | 2,234.67B | 1,862.20B | 1,865.60B | 0.00 | 0.00 | 0.00 | 0.00 | 0.00 | 1,330.03B | 296.91B | 253.46B |
| Gross Profit | 10,241.35B | 3,300.44B | 4,350.24B | 4,873.14B | 3,655.28B | 3,201.61B | 3,512.60B | 3,355.15B | 3,387.76B | 2,898.82B | 4,637.09B | 3,597.05B | 2,991.00B | 3,285.49B | 2,423.24B | 874.86B | 1,086.64B | 723.31B |
| Gross Profit Ratio | 100.00% | 52.21% | 56.79% | 59.25% | 55.84% | 52.39% | 57.84% | 60.02% | 64.53% | 60.84% | 100.00% | 100.00% | 100.00% | 100.00% | 100.00% | 39.68% | 78.54% | 74.05% |
| Research & Development | 0.00 | 18.08B | 19.23B | 13.59B | 16.18B | 28.99B | 30.59B | 19.65B | 16.74B | 19.77B | 29.49B | 24.16B | 28.52B | 19.95B | 15.49B | 0.00 | 6.54B | 5.85B |
| General & Administrative | 0.00 | 29.93B | 32.14B | 32.63B | 30.49B | 29.97B | 27.21B | 29.10B | 25.05B | 22.32B | 0.00 | 0.00 | 0.00 | 0.00 | 0.00 | 91.45B | 11.80B | 13.11B |
| Selling & Marketing | 0.00 | 0.00 | 0.00 | 0.00 | 0.00 | 0.00 | 0.00 | 0.00 | 0.00 | 0.00 | 33.75B | 27.13B | 23.62B | 7.49B | 6.67B | 0.00 | 0.00 | 0.00 |
| SG&A | 0.00 | 29.93B | 32.14B | 32.63B | 30.49B | 29.97B | 27.21B | 29.10B | 25.05B | 22.32B | 33.75B | 27.13B | 23.62B | 7.49B | 6.67B | 91.45B | 11.80B | 13.11B |
| Other Expenses | 7,681.41B | 2,689.84B | 2,933.89B | 2,788.37B | 2,754.47B | 2,213.84B | 2,042.65B | 1,896.55B | 1,750.48B | 1,551.03B | 2,840.26B | 2,423.94B | 2,057.02B | 1,782.42B | 1,792.24B | -31.03B | 614.31B | 441.75B |
| Operating Expenses | 7,681.41B | 2,737.84B | 2,985.25B | 2,834.59B | 2,801.13B | 2,272.80B | 2,100.45B | 1,945.30B | 1,792.27B | 1,593.11B | 2,903.51B | 2,475.23B | 2,109.17B | 1,809.86B | 1,814.40B | 60.42B | 632.66B | 460.70B |
| Cost & Expenses | 7,681.41B | 5,758.96B | 6,294.63B | 6,185.63B | 5,692.00B | 5,182.24B | 4,661.17B | 4,179.97B | 3,654.47B | 3,458.71B | 2,903.51B | 2,475.23B | 2,109.17B | 1,809.86B | 1,814.40B | 1,390.45B | 929.56B | 714.17B |
| Interest Income | 615.17B | 60.14B | 90.93B | 72.65B | 83.72B | 93.49B | 112.17B | 66.98B | 33.40B | 26.49B | 18.68B | 20.69B | 36.76B | 46.82B | 120.09B | 7.89B | 25.20B | 15.61B |
| Interest Expense | 499.11B | 73.45B | 76.43B | 50.38B | 53.33B | 71.56B | 66.86B | 44.75B | 42.77B | 36.99B | 32.00B | 38.71B | 74.17B | 59.91B | 76.97B | 47.51B | 36.20B | 25.17B |
| Depreciation & Amortization | 828.03B | 798.44B | 715.23B | 647.99B | 613.16B | 571.56B | 515.20B | 472.15B | 419.02B | 334.16B | 275.18B | 243.61B | 221.20B | 195.02B | 183.58B | 267.74B | 124.78B | 110.26B |
| EBITDA | 4,030.64B | 978.28B | 2,352.09B | 2,478.21B | 1,631.92B | 1,882.79B | 1,489.16B | 825.54B | 1,921.43B | 1,855.17B | 1,951.69B | 1,526.60B | 1,260.59B | 1,258.11B | 1,147.81B | 1,106.29B | 606.29B | 424.77B |
| EBITDA Ratio | 39.36% | 15.48% | 30.71% | 30.13% | 24.93% | 30.81% | 24.52% | 14.77% | 36.60% | 38.94% | 42.09% | 42.44% | 42.15% | 38.29% | 47.37% | 50.17% | 43.82% | 43.49% |
| Operating Income | 3,202.61B | 614.85B | 1,119.86B | 1,930.03B | 870.62B | 725.58B | 1,228.30B | 1,310.42B | 1,587.21B | 1,289.18B | 1,656.84B | 1,113.82B | 856.91B | 1,260.31B | 701.78B | 783.09B | 453.98B | 262.61B |
| Operating Income Ratio | 31.27% | 9.73% | 14.62% | 23.47% | 13.30% | 11.87% | 20.22% | 23.44% | 30.23% | 27.06% | 35.73% | 30.96% | 28.65% | 38.36% | 28.96% | 35.52% | 32.81% | 26.89% |
| Total Other Income/Expenses | -433.10B | -481.38B | 507.21B | -77.47B | 147.38B | 559.56B | -303.06B | -1,003.60B | -101.13B | 222.78B | 23.09B | 159.88B | 122.52B | -228.67B | 222.43B | 34.25B | -3.87B | 29.02B |
| Income Before Tax | 2,769.51B | 133.47B | 1,627.07B | 1,852.56B | 1,018.01B | 1,285.14B | 925.24B | 306.82B | 1,486.08B | 1,511.96B | 1,679.94B | 1,273.70B | 979.43B | 1,031.63B | 924.20B | 817.34B | 450.12B | 291.63B |
| Income Before Tax Ratio | 27.04% | 2.11% | 21.24% | 22.53% | 15.55% | 21.03% | 15.23% | 5.49% | 28.31% | 31.73% | 36.23% | 35.41% | 32.75% | 31.40% | 38.14% | 37.07% | 32.53% | 29.86% |
| Income Tax Expense | 610.43B | -28.94B | 357.55B | 323.57B | 251.13B | 288.03B | 120.04B | 149.63B | 320.38B | 301.39B | 337.49B | 275.71B | 185.64B | 260.25B | 229.22B | 238.66B | 134.18B | 79.89B |
| Net Income | 2,159.09B | 135.34B | 1,202.89B | 1,456.27B | 714.30B | 951.64B | 787.06B | 159.00B | 1,139.26B | 1,182.63B | 1,307.02B | 968.56B | 779.59B | 742.93B | 658.04B | 552.38B | 311.13B | 209.45B |
| Net Income Ratio | 21.08% | 2.14% | 15.70% | 17.71% | 10.91% | 15.57% | 12.96% | 2.84% | 21.70% | 24.82% | 28.19% | 26.93% | 26.06% | 22.61% | 27.16% | 25.05% | 22.49% | 21.44% |
| EPS | 182.63 | 11.45 | 106.92 | 131.79 | 64.64 | 84.22 | 68.44 | 13.83 | 99.50 | 103.29 | 114.15 | 84.59 | 66.35 | 63.50 | 56.24 | 48.15 | 29.08 | 20.84 |
| EPS Diluted | 182.63 | 11.45 | 106.92 | 131.79 | 64.64 | 84.22 | 68.44 | 13.83 | 99.50 | 103.29 | 114.15 | 84.59 | 66.35 | 63.50 | 56.24 | 48.15 | 29.08 | 20.84 |
| Weighted Avg Shares Out | 11.82B | 11.82B | 11.25B | 11.05B | 11.05B | 11.30B | 11.50B | 11.50B | 11.45B | 11.45B | 11.45B | 11.45B | 11.75B | 11.70B | 11.70B | 11.47B | 10.70B | 10.05B |
| Weighted Avg Shares Out (Dil) | 11.82B | 11.82B | 11.25B | 11.05B | 11.05B | 11.30B | 11.50B | 11.50B | 11.45B | 11.45B | 11.45B | 11.45B | 11.75B | 11.70B | 11.70B | 11.47B | 10.70B | 10.05B |
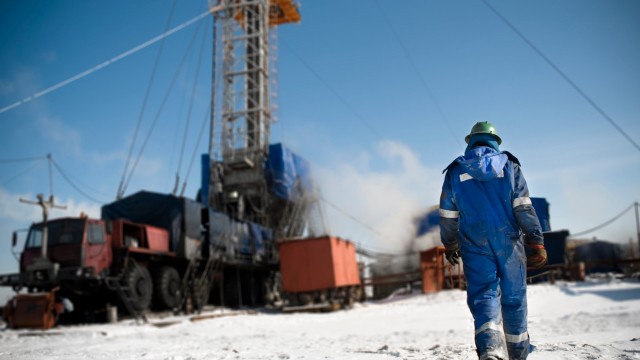
Russia's Gazprom hints at delay in resuming gas supplies to Germany with Nord Stream 1 safety warning
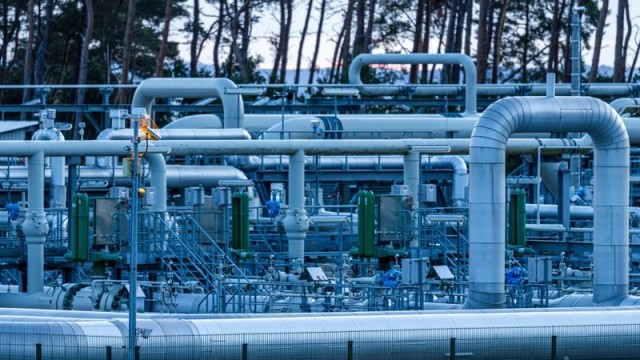
Gazprom casts doubt on natgas pipeline's quick return to full flow to Europe
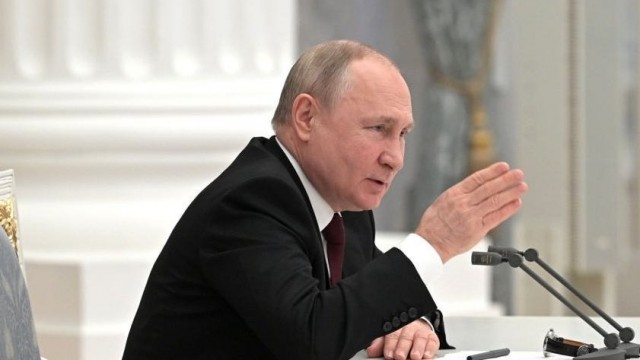
Russia eyes $22 billion in windfall tax revenue from Gazprom amid skyrocketing natural gas prices
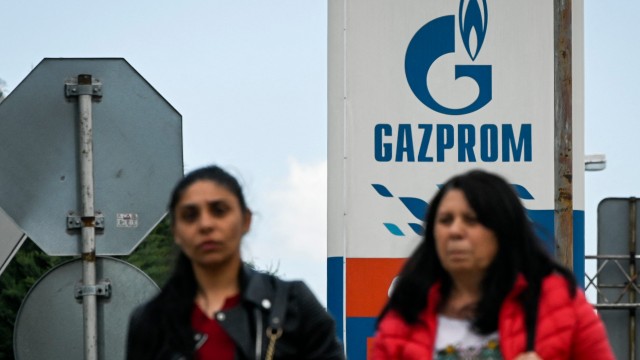
Russian gas giant Gazprom's shares slumped 30% after it nixed dividends for the first time since 1998
Shares Of Russia's Largest Public Company Gazprom Tank 30%
Gazprom shares crater after Russian energy giant cancels dividend for first time since 1998
Three Gazprom liquefied natural gas tankers have been seized by Germany for an indefinite period of time
Russian rouble up; Gazprom shares plummet after it skips dividend
Gazprom shares lose a quarter of value after halting dividend
Russia's Gazprom says shareholders decide against 2021 dividend
Source: https://incomestatements.info
Category: Stock Reports
