See more : Shandong Iron and Steel Company Ltd. (600022.SS) Income Statement Analysis – Financial Results
Complete financial analysis of Public Joint Stock Company Gazprom (OGZPY) income statement, including revenue, profit margins, EPS and key performance metrics. Get detailed insights into the financial performance of Public Joint Stock Company Gazprom, a leading company in the Oil & Gas Integrated industry within the Energy sector.
- Fiserv, Inc. (0IP9.L) Income Statement Analysis – Financial Results
- Sif Holding N.V. (SIFG.AS) Income Statement Analysis – Financial Results
- CC Neuberger Principal Holdings III (PRPC-UN) Income Statement Analysis – Financial Results
- Spire Inc. (SRCU) Income Statement Analysis – Financial Results
- Autoliv, Inc. (ALIV-SDB.ST) Income Statement Analysis – Financial Results
Public Joint Stock Company Gazprom (OGZPY)
About Public Joint Stock Company Gazprom
Public Joint Stock Company Gazprom, an integrated energy company, engages in the geological exploration, production, processing, storage, transportation, and sale of gas, gas condensates, and oil in Russia and internationally. The company operates through Production of Gas, Transportation of Gas, Distribution of Gas, Gas Storage, Production of Crude Oil and Gas Condensate, Refining, and Electric and Heat Energy Generation and Sales segments. It also produces coalbed methane; and owns Unified Gas Supply System, a gas transmission system totaling approximately 175.2 kilometers that comprises 254 compressor stations with a total capacity of 46.8 megawatts in Russia. In addition, the company operates underground gas storage facilities; operates oil refining and petrochemical complexes; generates and sells electric and heat energy; produces crude oil and gas condensate; and produces other goods, as well as provides other works and rendering of other services. Further, it offers oil, gas condensate, and other hydrocarbons; and sells refined products. Public Joint Stock Company Gazprom was founded in 1993 and is headquartered in Moscow, Russia.
| Metric | 2021 | 2020 | 2019 | 2018 | 2017 | 2016 | 2015 | 2014 | 2013 | 2012 | 2011 | 2010 | 2009 | 2008 | 2007 | 2006 | 2005 | 2004 |
|---|---|---|---|---|---|---|---|---|---|---|---|---|---|---|---|---|---|---|
| Revenue | 10,241.35B | 6,321.56B | 7,659.62B | 8,224.18B | 6,546.14B | 6,111.05B | 6,073.32B | 5,589.81B | 5,249.97B | 4,764.41B | 4,637.09B | 3,597.05B | 2,991.00B | 3,285.49B | 2,423.24B | 2,204.89B | 1,383.55B | 976.78B |
| Cost of Revenue | 0.00 | 3,021.12B | 3,309.38B | 3,351.04B | 2,890.87B | 2,909.45B | 2,560.72B | 2,234.67B | 1,862.20B | 1,865.60B | 0.00 | 0.00 | 0.00 | 0.00 | 0.00 | 1,330.03B | 296.91B | 253.46B |
| Gross Profit | 10,241.35B | 3,300.44B | 4,350.24B | 4,873.14B | 3,655.28B | 3,201.61B | 3,512.60B | 3,355.15B | 3,387.76B | 2,898.82B | 4,637.09B | 3,597.05B | 2,991.00B | 3,285.49B | 2,423.24B | 874.86B | 1,086.64B | 723.31B |
| Gross Profit Ratio | 100.00% | 52.21% | 56.79% | 59.25% | 55.84% | 52.39% | 57.84% | 60.02% | 64.53% | 60.84% | 100.00% | 100.00% | 100.00% | 100.00% | 100.00% | 39.68% | 78.54% | 74.05% |
| Research & Development | 0.00 | 18.08B | 19.23B | 13.59B | 16.18B | 28.99B | 30.59B | 19.65B | 16.74B | 19.77B | 29.49B | 24.16B | 28.52B | 19.95B | 15.49B | 0.00 | 6.54B | 5.85B |
| General & Administrative | 0.00 | 29.93B | 32.14B | 32.63B | 30.49B | 29.97B | 27.21B | 29.10B | 25.05B | 22.32B | 0.00 | 0.00 | 0.00 | 0.00 | 0.00 | 91.45B | 11.80B | 13.11B |
| Selling & Marketing | 0.00 | 0.00 | 0.00 | 0.00 | 0.00 | 0.00 | 0.00 | 0.00 | 0.00 | 0.00 | 33.75B | 27.13B | 23.62B | 7.49B | 6.67B | 0.00 | 0.00 | 0.00 |
| SG&A | 0.00 | 29.93B | 32.14B | 32.63B | 30.49B | 29.97B | 27.21B | 29.10B | 25.05B | 22.32B | 33.75B | 27.13B | 23.62B | 7.49B | 6.67B | 91.45B | 11.80B | 13.11B |
| Other Expenses | 7,681.41B | 2,689.84B | 2,933.89B | 2,788.37B | 2,754.47B | 2,213.84B | 2,042.65B | 1,896.55B | 1,750.48B | 1,551.03B | 2,840.26B | 2,423.94B | 2,057.02B | 1,782.42B | 1,792.24B | -31.03B | 614.31B | 441.75B |
| Operating Expenses | 7,681.41B | 2,737.84B | 2,985.25B | 2,834.59B | 2,801.13B | 2,272.80B | 2,100.45B | 1,945.30B | 1,792.27B | 1,593.11B | 2,903.51B | 2,475.23B | 2,109.17B | 1,809.86B | 1,814.40B | 60.42B | 632.66B | 460.70B |
| Cost & Expenses | 7,681.41B | 5,758.96B | 6,294.63B | 6,185.63B | 5,692.00B | 5,182.24B | 4,661.17B | 4,179.97B | 3,654.47B | 3,458.71B | 2,903.51B | 2,475.23B | 2,109.17B | 1,809.86B | 1,814.40B | 1,390.45B | 929.56B | 714.17B |
| Interest Income | 615.17B | 60.14B | 90.93B | 72.65B | 83.72B | 93.49B | 112.17B | 66.98B | 33.40B | 26.49B | 18.68B | 20.69B | 36.76B | 46.82B | 120.09B | 7.89B | 25.20B | 15.61B |
| Interest Expense | 499.11B | 73.45B | 76.43B | 50.38B | 53.33B | 71.56B | 66.86B | 44.75B | 42.77B | 36.99B | 32.00B | 38.71B | 74.17B | 59.91B | 76.97B | 47.51B | 36.20B | 25.17B |
| Depreciation & Amortization | 828.03B | 798.44B | 715.23B | 647.99B | 613.16B | 571.56B | 515.20B | 472.15B | 419.02B | 334.16B | 275.18B | 243.61B | 221.20B | 195.02B | 183.58B | 267.74B | 124.78B | 110.26B |
| EBITDA | 4,030.64B | 978.28B | 2,352.09B | 2,478.21B | 1,631.92B | 1,882.79B | 1,489.16B | 825.54B | 1,921.43B | 1,855.17B | 1,951.69B | 1,526.60B | 1,260.59B | 1,258.11B | 1,147.81B | 1,106.29B | 606.29B | 424.77B |
| EBITDA Ratio | 39.36% | 15.48% | 30.71% | 30.13% | 24.93% | 30.81% | 24.52% | 14.77% | 36.60% | 38.94% | 42.09% | 42.44% | 42.15% | 38.29% | 47.37% | 50.17% | 43.82% | 43.49% |
| Operating Income | 3,202.61B | 614.85B | 1,119.86B | 1,930.03B | 870.62B | 725.58B | 1,228.30B | 1,310.42B | 1,587.21B | 1,289.18B | 1,656.84B | 1,113.82B | 856.91B | 1,260.31B | 701.78B | 783.09B | 453.98B | 262.61B |
| Operating Income Ratio | 31.27% | 9.73% | 14.62% | 23.47% | 13.30% | 11.87% | 20.22% | 23.44% | 30.23% | 27.06% | 35.73% | 30.96% | 28.65% | 38.36% | 28.96% | 35.52% | 32.81% | 26.89% |
| Total Other Income/Expenses | -433.10B | -481.38B | 507.21B | -77.47B | 147.38B | 559.56B | -303.06B | -1,003.60B | -101.13B | 222.78B | 23.09B | 159.88B | 122.52B | -228.67B | 222.43B | 34.25B | -3.87B | 29.02B |
| Income Before Tax | 2,769.51B | 133.47B | 1,627.07B | 1,852.56B | 1,018.01B | 1,285.14B | 925.24B | 306.82B | 1,486.08B | 1,511.96B | 1,679.94B | 1,273.70B | 979.43B | 1,031.63B | 924.20B | 817.34B | 450.12B | 291.63B |
| Income Before Tax Ratio | 27.04% | 2.11% | 21.24% | 22.53% | 15.55% | 21.03% | 15.23% | 5.49% | 28.31% | 31.73% | 36.23% | 35.41% | 32.75% | 31.40% | 38.14% | 37.07% | 32.53% | 29.86% |
| Income Tax Expense | 610.43B | -28.94B | 357.55B | 323.57B | 251.13B | 288.03B | 120.04B | 149.63B | 320.38B | 301.39B | 337.49B | 275.71B | 185.64B | 260.25B | 229.22B | 238.66B | 134.18B | 79.89B |
| Net Income | 2,159.09B | 135.34B | 1,202.89B | 1,456.27B | 714.30B | 951.64B | 787.06B | 159.00B | 1,139.26B | 1,182.63B | 1,307.02B | 968.56B | 779.59B | 742.93B | 658.04B | 552.38B | 311.13B | 209.45B |
| Net Income Ratio | 21.08% | 2.14% | 15.70% | 17.71% | 10.91% | 15.57% | 12.96% | 2.84% | 21.70% | 24.82% | 28.19% | 26.93% | 26.06% | 22.61% | 27.16% | 25.05% | 22.49% | 21.44% |
| EPS | 182.63 | 11.45 | 106.92 | 131.79 | 64.64 | 84.22 | 68.44 | 13.83 | 99.50 | 103.29 | 114.15 | 84.59 | 66.35 | 63.50 | 56.24 | 48.15 | 29.08 | 20.84 |
| EPS Diluted | 182.63 | 11.45 | 106.92 | 131.79 | 64.64 | 84.22 | 68.44 | 13.83 | 99.50 | 103.29 | 114.15 | 84.59 | 66.35 | 63.50 | 56.24 | 48.15 | 29.08 | 20.84 |
| Weighted Avg Shares Out | 11.82B | 11.82B | 11.25B | 11.05B | 11.05B | 11.30B | 11.50B | 11.50B | 11.45B | 11.45B | 11.45B | 11.45B | 11.75B | 11.70B | 11.70B | 11.47B | 10.70B | 10.05B |
| Weighted Avg Shares Out (Dil) | 11.82B | 11.82B | 11.25B | 11.05B | 11.05B | 11.30B | 11.50B | 11.50B | 11.45B | 11.45B | 11.45B | 11.45B | 11.75B | 11.70B | 11.70B | 11.47B | 10.70B | 10.05B |

Russia's Gazprom cuts off Finland from gas supply amid NATO application
Poland's PGNiG seeks arbitration over Gazprom gas overpayments
Half of Gazprom's 54 clients opened Gazprombank accounts, says Russia's Novak
Gazprom cuts nominations for gas transit via Ukraine on May 13
Russian gas transit via Ukraine down to 72 mcm, Gazprom says
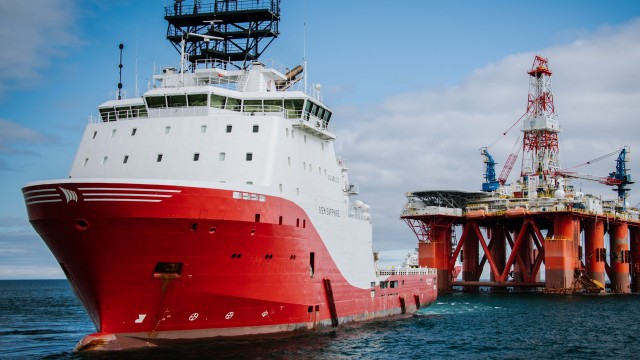
Moscow stopped sending gas to Poland, but Italy and France are plugging the gap with rerouted Russian supplies, says Gazprom
Russia's Gazprom continues gas exports to Europe via Ukraine
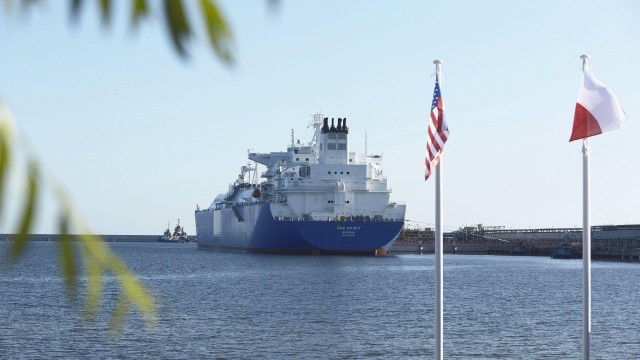
Poland And Bulgaria Gas Cutoff: ‘Closing Time' For Gazprom's Eurozone Cash Flows
Gazprom expects 4% fall in gas output in 2022
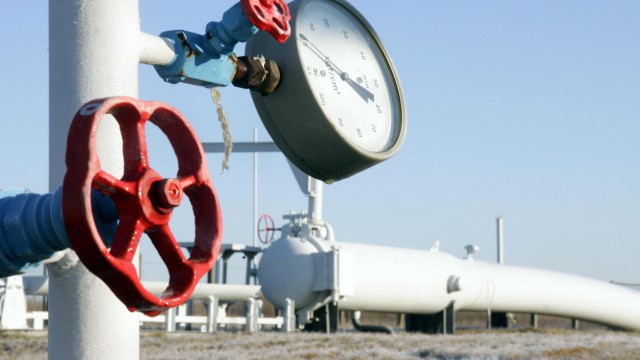
Gazprom Cuts Gas Supplies To Poland And Bulgaria
Source: https://incomestatements.info
Category: Stock Reports
