See more : Western Magnesium Corporation (MLYF) Income Statement Analysis – Financial Results
Complete financial analysis of ORBCOMM Inc. (ORBC) income statement, including revenue, profit margins, EPS and key performance metrics. Get detailed insights into the financial performance of ORBCOMM Inc., a leading company in the Communication Equipment industry within the Technology sector.
- Bougainville Copper Limited (BOCOF) Income Statement Analysis – Financial Results
- Western Acquisition Ventures Corp. (WAVSU) Income Statement Analysis – Financial Results
- S&W Seed Company (SANW) Income Statement Analysis – Financial Results
- Bhartiya International Ltd. (BIL.NS) Income Statement Analysis – Financial Results
- Koike Sanso Kogyo Co.,Ltd. (6137.T) Income Statement Analysis – Financial Results
ORBCOMM Inc. (ORBC)
About ORBCOMM Inc.
ORBCOMM Inc. provides Internet of Things solutions in the United States, South America, Japan, Europe, and internationally. The company offers network connectivity, devices, device management, and web reporting applications that are designed to track, monitor, control, and enhance security for various assets, such as trailers, trucks, rail cars, sea containers, power generators, fluid tanks, marine vessels, diesel or electric powered generators, oil and gas wells, pipeline monitoring equipment, irrigation control systems, and utility meters in transportation and supply chain, heavy equipment, fixed asset monitoring, and maritime industries, as well as for governments. It also provides satellite automatic identification service data services for vessel navigation and to enhance maritime safety for government and commercial customers; and vehicle fleet management, as well as in-cab and fleet vehicle solutions using various network platforms, including its own constellation of low-Earth orbit satellites and accompanying ground infrastructure, as well as terrestrial-based cellular communication services through reseller agreements with various cellular wireless providers. In addition, the company offers customer solutions utilizing additional satellite network service options through service agreements with third party mobile satellite providers; and resells service using the two-way Inmarsat plc satellite network to provide higher bandwidth. It markets and sells its products and services directly to original equipment manufacturers, government customers, and end-users, as well as indirectly through market channel partners and affiliates. ORBCOMM Inc. was founded in 2001 and is headquartered in Rochelle Park, New Jersey.
| Metric | 2020 | 2019 | 2018 | 2017 | 2016 | 2015 | 2014 | 2013 | 2012 | 2011 | 2010 | 2009 | 2008 | 2007 | 2006 | 2005 | 2004 | 2003 | 2002 | 2001 |
|---|---|---|---|---|---|---|---|---|---|---|---|---|---|---|---|---|---|---|---|---|
| Revenue | 248.47M | 272.01M | 276.14M | 254.22M | 186.74M | 178.29M | 96.24M | 74.21M | 64.50M | 46.31M | 36.68M | 27.57M | 30.09M | 28.15M | 24.52M | 15.53M | 10.87M | 7.08M | 3.27M | 1.99M |
| Cost of Revenue | 114.73M | 130.64M | 146.63M | 150.19M | 92.95M | 90.52M | 48.68M | 37.93M | 30.59M | 22.44M | 14.19M | 27.15M | 15.91M | 18.07M | 20.81M | 12.68M | 10.81M | 0.00 | 6.91M | 5.34M |
| Gross Profit | 133.74M | 141.37M | 129.51M | 104.03M | 93.79M | 87.77M | 47.56M | 36.28M | 33.91M | 23.87M | 22.48M | 415.00K | 14.18M | 10.08M | 3.71M | 2.85M | 61.00K | 7.08M | -3.64M | -3.35M |
| Gross Profit Ratio | 53.83% | 51.97% | 46.90% | 40.92% | 50.23% | 49.23% | 49.42% | 48.89% | 52.57% | 51.54% | 61.30% | 1.51% | 47.13% | 35.82% | 15.15% | 18.32% | 0.56% | 100.00% | -111.38% | -168.34% |
| Research & Development | 12.72M | 14.72M | 13.41M | 8.94M | 6.25M | 6.47M | 2.90M | 2.80M | 2.46M | 1.24M | 663.00K | 714.00K | 1.12M | 1.06M | 1.81M | 1.34M | 778.00K | 0.00 | 439.00K | 275.00K |
| General & Administrative | 70.18M | 69.59M | 66.99M | 55.75M | 46.92M | 44.40M | 30.99M | 26.13M | 21.85M | 20.04M | 16.73M | 17.17M | 18.93M | 17.69M | 15.73M | 0.00 | 0.00 | 0.00 | 0.00 | 0.00 |
| Selling & Marketing | 0.00 | 0.00 | 0.00 | 0.00 | 0.00 | 0.00 | 0.00 | 0.00 | 0.00 | 0.00 | 0.00 | 0.00 | 0.00 | 0.00 | 0.00 | 0.00 | 0.00 | 0.00 | 0.00 | 0.00 |
| SG&A | 70.18M | 69.59M | 66.99M | 55.75M | 46.92M | 44.40M | 30.99M | 26.13M | 21.85M | 20.04M | 16.73M | 17.17M | 18.93M | 17.69M | 15.73M | 0.00 | 0.00 | 0.00 | 0.00 | 0.00 |
| Other Expenses | 50.74M | 50.70M | 49.68M | 45.68M | 42.80M | 26.57M | 10.86M | 0.00 | 0.00 | 0.00 | 0.00 | -44.25M | -1.37M | 0.00 | 0.00 | 9.34M | 8.65M | 0.00 | 5.79M | 4.59M |
| Operating Expenses | 133.63M | 135.01M | 130.08M | 110.38M | 95.97M | 77.44M | 44.74M | 28.92M | 24.31M | 21.27M | 17.39M | -26.36M | 18.68M | 18.75M | 17.55M | 10.69M | 9.42M | 0.00 | 6.23M | 4.87M |
| Cost & Expenses | 248.36M | 265.65M | 276.71M | 260.56M | 188.92M | 167.96M | 93.42M | 66.85M | 54.90M | 43.71M | 31.59M | 787.00K | 34.59M | 36.82M | 38.35M | 23.37M | 20.23M | 0.00 | 13.14M | 10.21M |
| Interest Income | 0.00 | 0.00 | 0.00 | 0.00 | 0.00 | 0.00 | 0.00 | 0.00 | 0.00 | 0.00 | 0.00 | 0.00 | 0.00 | 0.00 | 0.00 | 0.00 | 0.00 | 0.00 | 0.00 | 0.00 |
| Interest Expense | 19.96M | 21.15M | 21.06M | 17.65M | 9.09M | 5.24M | 149.00K | 58.00K | 56.00K | 164.00K | 192.00K | 193.00K | 0.00 | 0.00 | 0.00 | 0.00 | 0.00 | 0.00 | 0.00 | 0.00 |
| Depreciation & Amortization | 50.74M | 50.70M | 49.68M | 45.68M | 42.80M | 26.57M | 10.86M | 6.00M | 4.82M | 5.00M | 4.32M | 19.12M | 3.24M | 2.42M | 2.37M | 2.01M | 2.20M | -20.40M | 5.01M | -653.00K |
| EBITDA | 38.41M | 57.81M | 49.15M | 1.64M | 28.89M | 19.79M | 6.73M | 11.95M | 15.01M | 5.97M | -876.00K | 15.87M | -1.30M | -1.17M | -8.84M | -7.09M | -10.19M | -13.32M | -4.86M | -8.87M |
| EBITDA Ratio | 15.46% | 21.25% | 17.80% | 0.65% | 15.47% | 11.10% | 6.99% | 16.11% | 23.28% | 12.89% | -2.39% | 57.57% | -4.33% | -4.17% | -36.06% | -45.63% | -93.75% | -188.07% | -148.62% | -445.63% |
| Operating Income | 108.00K | 6.36M | -565.00K | -6.34M | -2.18M | 10.34M | 2.82M | 7.36M | 9.60M | 2.59M | 5.09M | 26.78M | -4.50M | -8.66M | -13.83M | -7.84M | -9.36M | 7.08M | -9.87M | -8.22M |
| Operating Income Ratio | 0.04% | 2.34% | -0.20% | -2.50% | -1.17% | 5.80% | 2.93% | 9.92% | 14.88% | 5.60% | 13.88% | 97.15% | -14.95% | -30.77% | -56.41% | -50.49% | -86.17% | 100.00% | -302.05% | -412.81% |
| Total Other Income/Expenses | -32.28M | -20.11M | -20.72M | -55.26M | -20.53M | -22.11M | -6.94M | -1.31M | 698.00K | -1.82M | -6.50M | -29.03M | 398.00K | 25.00K | 271.00K | -1.02M | -1.76M | 0.00 | 0.00 | 0.00 |
| Income Before Tax | -32.17M | -13.75M | -21.28M | -61.60M | -22.71M | -11.77M | -4.12M | 6.05M | 10.29M | 771.00K | -1.41M | -2.25M | -4.10M | -8.64M | -13.56M | -8.86M | -11.12M | 0.00 | 0.00 | 0.00 |
| Income Before Tax Ratio | -12.95% | -5.05% | -7.71% | -24.23% | -12.16% | -6.60% | -4.28% | 8.16% | 15.96% | 1.67% | -3.84% | -8.15% | -13.63% | -30.68% | -55.30% | -57.04% | -102.34% | 0.00% | 0.00% | 0.00% |
| Income Tax Expense | 1.66M | 4.38M | 4.66M | -409.00K | 517.00K | 1.23M | 408.00K | 1.30M | 1.39M | 827.00K | -216.00K | -28.83M | 398.00K | 25.00K | 271.00K | -1.02M | -1.76M | 20.40M | -5.01M | 653.00K |
| Net Income | -33.94M | -18.42M | -26.24M | -61.28M | -23.51M | -13.25M | -4.68M | 4.60M | 8.74M | -18.00K | -5.17M | -3.44M | -4.54M | -3.59M | -11.22M | -9.10M | -12.39M | -13.32M | -4.86M | -8.87M |
| Net Income Ratio | -13.66% | -6.77% | -9.50% | -24.11% | -12.59% | -7.43% | -4.87% | 6.20% | 13.55% | -0.04% | -14.09% | -12.48% | -15.09% | -12.75% | -45.74% | -58.59% | -114.02% | -188.07% | -148.62% | -445.63% |
| EPS | -0.43 | -0.23 | -0.34 | -0.84 | -0.33 | -0.19 | -0.08 | 0.10 | 0.19 | 0.00 | -0.12 | -0.08 | -0.11 | -0.09 | -1.32 | -1.07 | -1.46 | -0.37 | -0.83 | -1.52 |
| EPS Diluted | -0.43 | -0.23 | -0.34 | -0.84 | -0.33 | -0.19 | -0.08 | 0.09 | 0.18 | 0.00 | -0.12 | -0.08 | -0.11 | -0.09 | -1.32 | -1.07 | -1.46 | -0.37 | -0.57 | -1.04 |
| Weighted Avg Shares Out | 78.06M | 79.26M | 77.60M | 72.88M | 70.91M | 70.42M | 56.68M | 47.42M | 46.64M | 44.58M | 42.59M | 42.40M | 41.98M | 39.71M | 8.49M | 8.49M | 8.49M | 36.30M | 5.82M | 5.82M |
| Weighted Avg Shares Out (Dil) | 78.06M | 79.26M | 77.60M | 72.88M | 70.91M | 70.42M | 56.68M | 48.77M | 47.51M | 44.58M | 42.59M | 42.40M | 41.98M | 39.71M | 8.49M | 8.49M | 8.49M | 36.30M | 8.54M | 8.54M |

The ORBCOMM Platform Wins 2020 IoT Edge Computing Excellence Award

The ORBCOMM Platform Wins 2020 IoT Edge Computing Excellence Award

ORBCOMM (ORBC) to Release Earnings on Wednesday

ORBCOMM’s New, Versatile Communication Device Enables Solution Providers to Easily Add Satellite Connectivity to IOT Applications

ORBCOMM's New, Versatile Communication Device Enables Solution Providers to Easily Add Satellite Connectivity to IOT Applications

$60.40 Million in Sales Expected for ORBCOMM Inc. (NASDAQ:ORBC) This Quarter

Orbcomm Set To Rebound From Here (NASDAQ:ORBC)

MarineTraffic Extends Partnership With ORBCOMM for Satellite AIS Data

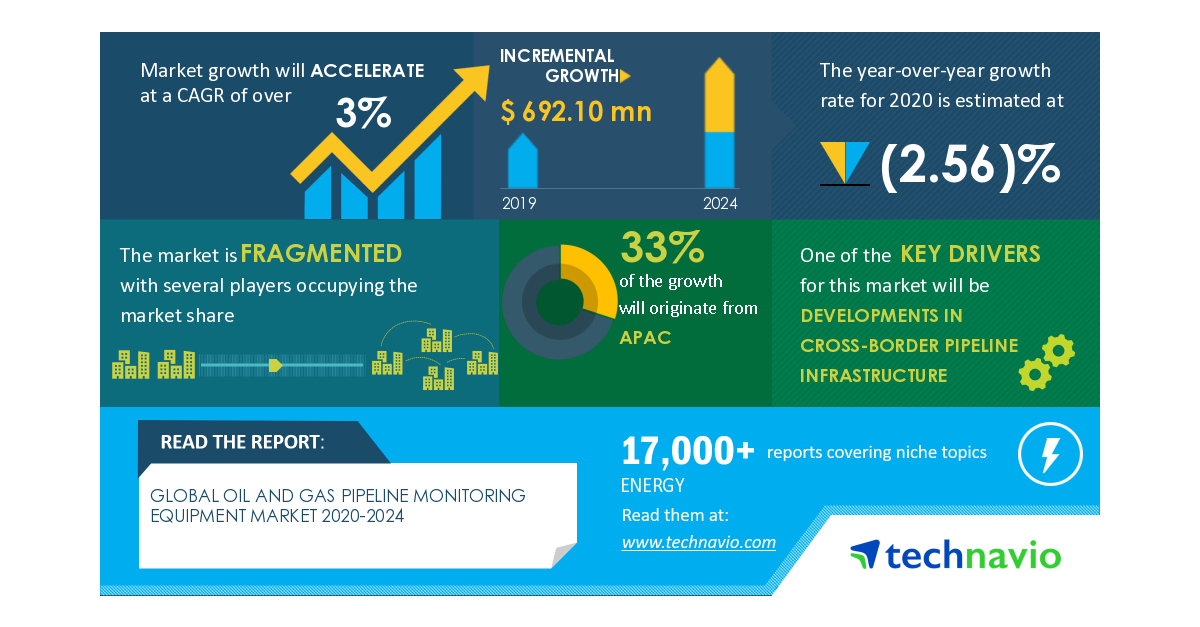
Oil and Gas Pipeline Monitoring Equipment Market Will Showcase Negative Impact During 2020-2024 | Developments in Cross-border and Cross-country Pipeline Infrastructure to Boost Market Growth | Technavio
Africa Wildlife Tracking Leverages ORBCOMM’s Satellite IoT Technology to Support Conservation Efforts Around the World
Source: https://incomestatements.info
Category: Stock Reports
