See more : Zoltav Resources Inc. (ZOL.L) Income Statement Analysis – Financial Results
Complete financial analysis of Orgenesis Inc. (ORGS) income statement, including revenue, profit margins, EPS and key performance metrics. Get detailed insights into the financial performance of Orgenesis Inc., a leading company in the Biotechnology industry within the Healthcare sector.
- West Fraser Timber Co. Ltd. (WFG) Income Statement Analysis – Financial Results
- Xiaomi Corporation (3CP.F) Income Statement Analysis – Financial Results
- PT Era Mandiri Cemerlang Tbk (IKAN.JK) Income Statement Analysis – Financial Results
- ITOCHU Corporation (8001.T) Income Statement Analysis – Financial Results
- Nutrition SC Public Company Limited (NTSC.BK) Income Statement Analysis – Financial Results
Orgenesis Inc. (ORGS)
About Orgenesis Inc.
Orgenesis Inc., a biotech company, focusing on cell and gene therapies worldwide. The company develops a Point of Care (POCare) platform that includes a pipeline of licensed POCare therapeutics that are processed and produced in closed automated POCare technology systems across a collaborative POCare network. It focuses on autologous therapies, with processes and systems that are developed for each therapy using a closed and automated processing system approach that is validated for compliant production near the patient at their point of care for treatment of the patient. The company was formerly known as Business Outsourcing Service, Inc. and changed its name to Orgenesis Inc. in August 2011. Orgenesis Inc. was incorporated in 2008 and is based in Germantown, Maryland.
| Metric | 2023 | 2022 | 2021 | 2020 | 2019 | 2018 | 2017 | 2016 | 2015 | 2014 | 2013 | 2012 | 2011 | 2010 | 2009 | 2008 |
|---|---|---|---|---|---|---|---|---|---|---|---|---|---|---|---|---|
| Revenue | 530.00K | 36.03M | 35.50M | 7.65M | 33.26M | 18.66M | 10.09M | 6.40M | 2.97M | 0.00 | 0.00 | 0.00 | 0.00 | 0.00 | 0.00 | 0.00 |
| Cost of Revenue | 6.26M | 20.44M | 28.16M | 30.62M | 18.12M | 10.70M | 6.81M | 7.66M | 3.88M | 0.00 | 0.00 | 0.00 | 0.00 | 0.00 | 0.00 | 500.00 |
| Gross Profit | -5.73M | 15.59M | 7.34M | -22.97M | 15.14M | 7.96M | 3.28M | -1.26M | -906.00K | 0.00 | 0.00 | 0.00 | 0.00 | 0.00 | 0.00 | -500.00 |
| Gross Profit Ratio | -1,080.19% | 43.26% | 20.68% | -300.13% | 45.53% | 42.65% | 32.53% | -19.70% | -30.46% | 0.00% | 0.00% | 0.00% | 0.00% | 0.00% | 0.00% | 0.00% |
| Research & Development | 11.09M | 6.01M | 36.64M | 83.99M | 12.46M | 6.46M | 2.48M | 2.16M | 1.07M | 1.69M | 1.64M | 2.31M | 0.00 | 0.00 | 0.00 | 0.00 |
| General & Administrative | 34.62M | 16.16M | 15.40M | 19.35M | 25.25M | 16.61M | 10.69M | 6.45M | 4.04M | 2.88M | 3.82M | 2.68M | 72.35K | 21.17K | 25.65K | 0.00 |
| Selling & Marketing | 464.00K | -566.00K | -687.00K | -380.00K | 1.15M | 1.21M | 599.00K | 397.00K | 326.00K | 144.00K | 187.83K | 140.94K | 0.00 | 0.00 | 0.00 | 0.00 |
| SG&A | 34.62M | 16.16M | 14.71M | 18.97M | 25.25M | 16.61M | 10.69M | 6.45M | 4.04M | 2.88M | 3.82M | 2.68M | 72.35K | 21.17K | 25.65K | 3.00K |
| Other Expenses | 0.00 | 788.00K | -1.33M | 474.00K | 2.04M | -1.02M | 1.63M | 2.12M | 1.20M | 0.00 | 0.00 | 0.00 | 0.00 | 0.00 | 0.00 | 3.00K |
| Operating Expenses | 45.76M | 22.95M | 50.02M | 103.43M | 39.74M | 22.06M | 14.80M | 10.23M | 6.31M | 4.58M | 5.46M | 4.99M | 72.35K | 21.17K | 25.65K | 3.00K |
| Cost & Expenses | 52.01M | 43.39M | 50.02M | 103.43M | 57.86M | 32.75M | 21.60M | 17.88M | 10.19M | 4.58M | 5.46M | 4.99M | 72.35K | 21.17K | 25.65K | 3.50K |
| Interest Income | 0.00 | 1.82M | 943.00K | 1.25M | 498.00K | 0.00 | 0.00 | 0.00 | 0.00 | 0.00 | 0.00 | 0.00 | 0.00 | 0.00 | 0.00 | 0.00 |
| Interest Expense | 2.17M | 1.82M | 1.29M | 1.06M | 461.00K | 2.75M | 1.23M | 689.00K | 696.00K | 691.09K | 172.51K | 0.00 | 0.00 | 0.00 | 0.00 | 0.00 |
| Depreciation & Amortization | 1.56M | 1.98M | 1.86M | 1.44M | 3.81M | 2.62M | 2.60M | 2.92M | 1.99M | 4.55K | 3.26K | 1.41K | 0.00 | 15.00K | 0.00 | 0.00 |
| EBITDA | -60.72M | -8.30M | -15.72M | -94.21M | -18.91M | -12.39M | -9.85M | -9.04M | -2.64M | -4.80M | -5.36M | -5.00M | -72.35K | -6.17K | -25.65K | -3.50K |
| EBITDA Ratio | -11,456.23% | -19.15% | -39.00% | -1,244.08% | -62.73% | -65.47% | -100.96% | -135.77% | -175.52% | 0.00% | 0.00% | 0.00% | 0.00% | 0.00% | 0.00% | 0.00% |
| Operating Income | -53.64M | -7.37M | -42.68M | -95.78M | -24.60M | -14.65M | -11.23M | 11.28M | -7.21M | -4.58M | -5.46M | -4.99M | -72.35K | -21.17K | -25.65K | -3.50K |
| Operating Income Ratio | -10,120.00% | -20.45% | -120.22% | -1,251.71% | -73.98% | -78.53% | -111.31% | 176.29% | -242.47% | 0.00% | 0.00% | 0.00% | 0.00% | 0.00% | 0.00% | 0.00% |
| Total Other Income/Expenses | -10.81M | -1.85M | -1.15M | -1.63M | -47.00K | -2.83M | -3.66M | -1.26M | 1.85M | -927.10K | -78.66K | -519.21K | 0.00 | -15.00K | 0.00 | 0.00 |
| Income Before Tax | -64.44M | -11.96M | -17.95M | -96.74M | -25.48M | -17.77M | -13.68M | -10.74M | -5.36M | -5.50M | -5.54M | -5.00M | -72.35K | -36.17K | -25.65K | -3.50K |
| Income Before Tax Ratio | -12,159.43% | -33.20% | -50.56% | -1,264.19% | -76.61% | -95.24% | -135.56% | -167.91% | -180.26% | 0.00% | 0.00% | 0.00% | 0.00% | 0.00% | 0.00% | 0.00% |
| Income Tax Expense | 473.00K | 209.00K | 108.00K | -1.61M | 563.00K | 1.34M | -1.31M | -1.55M | -900.00K | 691.09K | 172.51K | 9.58K | 0.00 | 0.00 | 0.00 | 0.00 |
| Net Income | -55.36M | -12.17M | -18.06M | -95.13M | -26.04M | -18.29M | -12.37M | -9.19M | -4.46M | -5.50M | -5.54M | -5.00M | -72.35K | -36.17K | -25.65K | -3.50K |
| Net Income Ratio | -10,445.47% | -33.78% | -50.87% | -1,243.17% | -78.30% | -98.05% | -122.58% | -143.72% | -150.00% | 0.00% | 0.00% | 0.00% | 0.00% | 0.00% | 0.00% | 0.00% |
| EPS | -1.91 | -0.48 | -0.74 | -4.46 | -1.64 | -1.37 | -1.28 | -1.08 | -0.96 | -1.22 | -1.32 | -1.11 | -0.01 | -0.01 | 0.00 | 0.00 |
| EPS Diluted | -1.91 | -0.48 | -0.74 | -4.46 | -1.64 | -1.37 | -1.27 | -1.08 | -0.94 | -1.21 | -1.32 | -1.11 | -0.01 | -0.01 | 0.00 | 0.00 |
| Weighted Avg Shares Out | 29.01M | 25.10M | 24.27M | 21.32M | 15.91M | 13.37M | 9.68M | 8.52M | 4.65M | 4.51M | 4.20M | 4.52M | 6.71M | 6.71M | 6.71M | 6.71M |
| Weighted Avg Shares Out (Dil) | 29.01M | 25.10M | 24.27M | 21.32M | 15.91M | 13.37M | 9.71M | 8.52M | 4.74M | 4.56M | 4.21M | 4.52M | 6.71M | 6.71M | 6.71M | 6.71M |

Trump tweets ‘Don’t buy Goodyear Tires’ after company bans workers from wearing MAGA attire

Goodyear's stock fall after Trump tweet urging boycott of company's tires, while rivals' shares gain
Morgan Stanley Acquires 18,132 Shares of Cooper Tire & Rubber Co (NYSE:CTB)
Eurogate Has Gone Live With Navis N4 at Its Bremerhaven Terminal
Zacks: Analysts Anticipate Cooper Tire & Rubber Co (NYSE:CTB) Will Post Quarterly Sales of $481.64 Million

Vetter further expands its Development Service with new site in Austria

ESG Strategies - What Investors Expect From ETFs
Two Sigma Advisers LP Sells 3,600 Shares of Cooper Tire & Rubber Co (NYSE:CTB)
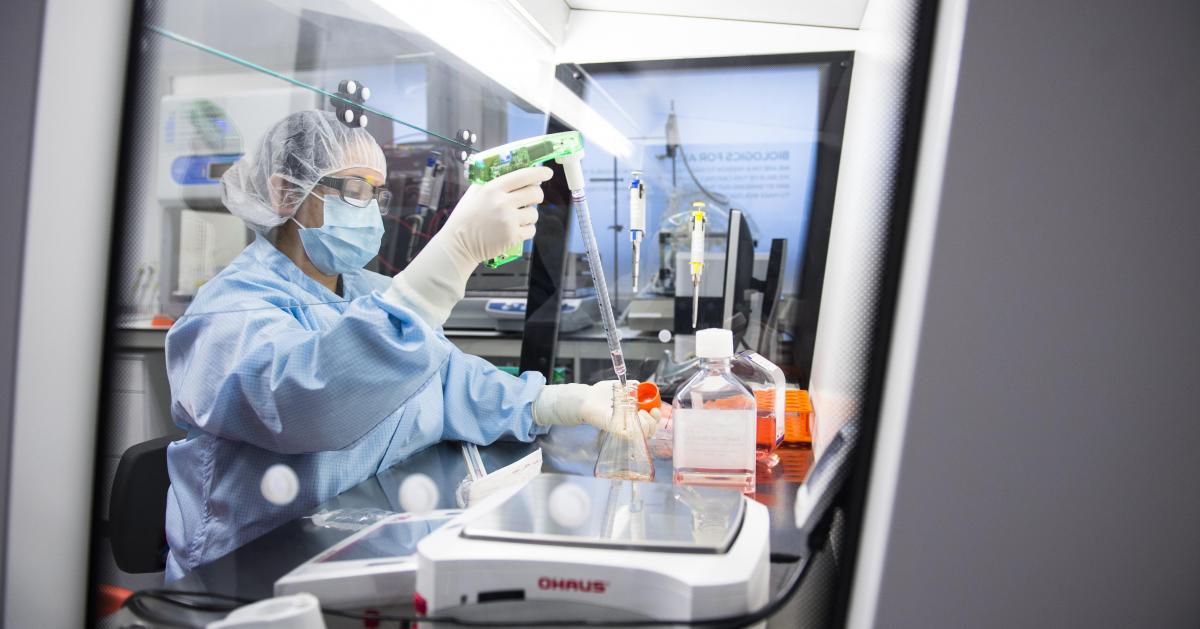
Le BioPark de Charleroi recrutera près de 500 personnes: tous les profils sont recherchés!
Source: https://incomestatements.info
Category: Stock Reports

