See more : Federal National Mortgage Association (FNMAI) Income Statement Analysis – Financial Results
Complete financial analysis of Perseus Mining Limited (PMNXF) income statement, including revenue, profit margins, EPS and key performance metrics. Get detailed insights into the financial performance of Perseus Mining Limited, a leading company in the Gold industry within the Basic Materials sector.
- Eezy Oyj (EEZY.HE) Income Statement Analysis – Financial Results
- China Gas Industry Investment Holdings Co. Ltd. (1940.HK) Income Statement Analysis – Financial Results
- Cantex Mine Development Corp. (CTXDF) Income Statement Analysis – Financial Results
- SUPER HI INTERNATIONAL HOLDING LTD. American Depositary Shares (HDL) Income Statement Analysis – Financial Results
- Nitto Denko Corporation (6988.T) Income Statement Analysis – Financial Results
Perseus Mining Limited (PMNXF)
About Perseus Mining Limited
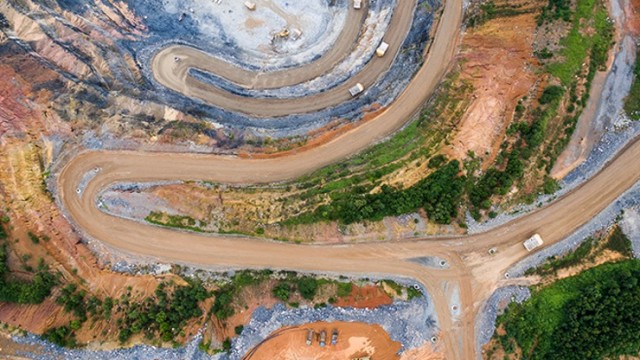
Perseus Mining Limited explores, evaluates, develops, and mines for gold properties in West Africa. The company primarily holds interests in the Edikan gold mine project located in Ghana; and Sissingué and Yaoure gold projects located in Côte d'Ivoire. Perseus Mining Limited was incorporated in 2003 and is based in Subiaco, Australia.
| Metric | 2024 | 2023 | 2022 | 2021 | 2020 | 2019 | 2018 | 2017 | 2016 |
|---|---|---|---|---|---|---|---|---|---|
| Revenue | 685.64M | 1.43B | 1.13B | 679.73M | 591.24M | 508.65M | 378.08M | 276.92M | 244.94M |
| Cost of Revenue | 267.73M | 605.11M | 561.41M | 376.67M | 317.40M | 497.89M | 359.92M | 309.32M | 274.74M |
| Gross Profit | 417.91M | 821.31M | 564.14M | 303.07M | 273.84M | 10.75M | 18.15M | -32.40M | -29.80M |
| Gross Profit Ratio | 60.95% | 57.58% | 50.12% | 44.59% | 46.32% | 2.11% | 4.80% | -11.70% | -12.17% |
| Research & Development | 0.00 | 0.00 | 0.00 | 0.00 | 0.00 | 0.00 | 0.00 | 0.00 | 0.00 |
| General & Administrative | 12.37M | 27.40M | 25.51M | 19.58M | 22.02M | 0.00 | 0.00 | 0.00 | 0.00 |
| Selling & Marketing | 0.00 | 0.00 | 0.00 | 0.00 | 0.00 | 0.00 | 0.00 | 0.00 | 0.00 |
| SG&A | 12.37M | 27.40M | 25.51M | 19.58M | 22.02M | 16.98M | 13.06M | 17.59M | 12.07M |
| Other Expenses | 405.54M | 6.85M | 15.52M | -3.51M | 17.79M | 0.00 | 0.00 | 0.00 | 0.00 |
| Operating Expenses | 417.91M | 252.24M | 247.41M | 124.43M | 160.72M | 16.98M | 13.06M | 17.59M | 12.07M |
| Cost & Expenses | 685.64M | 857.35M | 808.82M | 501.10M | 478.12M | 514.88M | 372.99M | 326.91M | 286.81M |
| Interest Income | 7.71M | 8.95M | 532.00K | 0.00 | 0.00 | 2.16M | 786.00K | 616.00K | 1.05M |
| Interest Expense | 4.36M | 6.75M | 9.68M | 4.53M | 4.09M | 5.90M | 3.04M | 303.00K | 228.52K |
| Depreciation & Amortization | 95.17M | 219.92M | 215.33M | 104.94M | 134.11M | 153.36M | 119.64M | 56.20M | 48.09M |
| EBITDA | 411.74M | 526.25M | 346.98M | 195.37M | 244.85M | 97.08M | 124.73M | 6.22M | 6.21M |
| EBITDA Ratio | 60.05% | 56.39% | 43.86% | 39.26% | 41.41% | 28.93% | 32.99% | 2.25% | 2.54% |
| Operating Income | -0.46 | 584.88M | 332.78M | 175.13M | 130.91M | -6.23M | 5.09M | -49.98M | -41.88M |
| Operating Income Ratio | 0.00% | 41.00% | 29.57% | 25.76% | 22.14% | -1.23% | 1.35% | -18.05% | -17.10% |
| Total Other Income/Expenses | 312.21M | 568.78M | 279.71M | 163.04M | -4.24M | 12.02M | -19.13M | -41.67M | -10.58M |
| Income Before Tax | 312.21M | 568.78M | 279.71M | 163.04M | 126.67M | 5.79M | -19.11M | -100.39M | -44.30M |
| Income Before Tax Ratio | 45.54% | 39.87% | 24.85% | 23.99% | 21.42% | 1.14% | -5.06% | -36.25% | -18.09% |
| Income Tax Expense | 68.41M | 92.06M | -207.00K | 23.67M | 32.24M | -1.79M | 5.79M | -17.27M | -6.75M |
| Net Income | 216.75M | 427.40M | 233.60M | 87.32M | 94.36M | 6.99M | -25.85M | -79.61M | -35.64M |
| Net Income Ratio | 31.61% | 29.96% | 20.75% | 12.85% | 15.96% | 1.37% | -6.84% | -28.75% | -14.55% |
| EPS | 0.35 | 0.31 | 0.19 | 0.10 | 0.08 | 0.01 | -0.03 | -0.08 | -0.06 |
| EPS Diluted | 0.35 | 0.31 | 0.18 | 0.09 | 0.08 | 0.01 | -0.03 | -0.08 | -0.06 |
| Weighted Avg Shares Out | 1.38B | 1.37B | 1.24B | 1.21B | 1.17B | 1.06B | 1.03B | 1.03B | 621.36M |
| Weighted Avg Shares Out (Dil) | 1.38B | 1.38B | 1.27B | 1.24B | 1.20B | 1.18B | 1.03B | 1.03B | 621.36M |

Perseus Mining confident of Yaouré gold inventory growth after latest drilling success

Perseus Mining finds exploration success in Ghana amid Nkosuo prospect drilling

Perseus Mining has target price raised by Citi Research after FY2021 net profit rises to A$139 million

Perseus Mining Ltd (PMNXF) CEO Jeffrey Quartermaine on Q4 2021 Results - Earnings Call Transcript

Perseus Mining increases net profit by 48% in FY2021 to $139 million and declares maiden dividend

Perseus Mining Announces Dividend Policy and Maiden Capital Return

Perseus Mining performs strongly as it tracks towards annual gold production of 500,000 ounces

Perseus Mining's encouraging drilling results continue to demonstrate growth potential across gold projects in West Africa

Perseus Mining boosts Yaouré gold production forecast to 1.43 million ounces over life of mine

Perseus Mining named “top pick” by Cannacord
Source: https://incomestatements.info
Category: Stock Reports
