See more : SPIE SA (SPIE.PA) Income Statement Analysis – Financial Results
Complete financial analysis of Perseus Mining Limited (PMNXF) income statement, including revenue, profit margins, EPS and key performance metrics. Get detailed insights into the financial performance of Perseus Mining Limited, a leading company in the Gold industry within the Basic Materials sector.
- Tian Ruixiang Holdings Ltd (TIRX) Income Statement Analysis – Financial Results
- AMCON Distributing Company (DIT) Income Statement Analysis – Financial Results
- Rifa Co.,Ltd. (000760.KS) Income Statement Analysis – Financial Results
- Relevium Technologies Inc. (RLLVF) Income Statement Analysis – Financial Results
- Phonic Corporation (3067.TWO) Income Statement Analysis – Financial Results
Perseus Mining Limited (PMNXF)
About Perseus Mining Limited
Perseus Mining Limited explores, evaluates, develops, and mines for gold properties in West Africa. The company primarily holds interests in the Edikan gold mine project located in Ghana; and Sissingué and Yaoure gold projects located in Côte d'Ivoire. Perseus Mining Limited was incorporated in 2003 and is based in Subiaco, Australia.
| Metric | 2024 | 2023 | 2022 | 2021 | 2020 | 2019 | 2018 | 2017 | 2016 |
|---|---|---|---|---|---|---|---|---|---|
| Revenue | 685.64M | 1.43B | 1.13B | 679.73M | 591.24M | 508.65M | 378.08M | 276.92M | 244.94M |
| Cost of Revenue | 267.73M | 605.11M | 561.41M | 376.67M | 317.40M | 497.89M | 359.92M | 309.32M | 274.74M |
| Gross Profit | 417.91M | 821.31M | 564.14M | 303.07M | 273.84M | 10.75M | 18.15M | -32.40M | -29.80M |
| Gross Profit Ratio | 60.95% | 57.58% | 50.12% | 44.59% | 46.32% | 2.11% | 4.80% | -11.70% | -12.17% |
| Research & Development | 0.00 | 0.00 | 0.00 | 0.00 | 0.00 | 0.00 | 0.00 | 0.00 | 0.00 |
| General & Administrative | 12.37M | 27.40M | 25.51M | 19.58M | 22.02M | 0.00 | 0.00 | 0.00 | 0.00 |
| Selling & Marketing | 0.00 | 0.00 | 0.00 | 0.00 | 0.00 | 0.00 | 0.00 | 0.00 | 0.00 |
| SG&A | 12.37M | 27.40M | 25.51M | 19.58M | 22.02M | 16.98M | 13.06M | 17.59M | 12.07M |
| Other Expenses | 405.54M | 6.85M | 15.52M | -3.51M | 17.79M | 0.00 | 0.00 | 0.00 | 0.00 |
| Operating Expenses | 417.91M | 252.24M | 247.41M | 124.43M | 160.72M | 16.98M | 13.06M | 17.59M | 12.07M |
| Cost & Expenses | 685.64M | 857.35M | 808.82M | 501.10M | 478.12M | 514.88M | 372.99M | 326.91M | 286.81M |
| Interest Income | 7.71M | 8.95M | 532.00K | 0.00 | 0.00 | 2.16M | 786.00K | 616.00K | 1.05M |
| Interest Expense | 4.36M | 6.75M | 9.68M | 4.53M | 4.09M | 5.90M | 3.04M | 303.00K | 228.52K |
| Depreciation & Amortization | 95.17M | 219.92M | 215.33M | 104.94M | 134.11M | 153.36M | 119.64M | 56.20M | 48.09M |
| EBITDA | 411.74M | 526.25M | 346.98M | 195.37M | 244.85M | 97.08M | 124.73M | 6.22M | 6.21M |
| EBITDA Ratio | 60.05% | 56.39% | 43.86% | 39.26% | 41.41% | 28.93% | 32.99% | 2.25% | 2.54% |
| Operating Income | -0.46 | 584.88M | 332.78M | 175.13M | 130.91M | -6.23M | 5.09M | -49.98M | -41.88M |
| Operating Income Ratio | 0.00% | 41.00% | 29.57% | 25.76% | 22.14% | -1.23% | 1.35% | -18.05% | -17.10% |
| Total Other Income/Expenses | 312.21M | 568.78M | 279.71M | 163.04M | -4.24M | 12.02M | -19.13M | -41.67M | -10.58M |
| Income Before Tax | 312.21M | 568.78M | 279.71M | 163.04M | 126.67M | 5.79M | -19.11M | -100.39M | -44.30M |
| Income Before Tax Ratio | 45.54% | 39.87% | 24.85% | 23.99% | 21.42% | 1.14% | -5.06% | -36.25% | -18.09% |
| Income Tax Expense | 68.41M | 92.06M | -207.00K | 23.67M | 32.24M | -1.79M | 5.79M | -17.27M | -6.75M |
| Net Income | 216.75M | 427.40M | 233.60M | 87.32M | 94.36M | 6.99M | -25.85M | -79.61M | -35.64M |
| Net Income Ratio | 31.61% | 29.96% | 20.75% | 12.85% | 15.96% | 1.37% | -6.84% | -28.75% | -14.55% |
| EPS | 0.35 | 0.31 | 0.19 | 0.10 | 0.08 | 0.01 | -0.03 | -0.08 | -0.06 |
| EPS Diluted | 0.35 | 0.31 | 0.18 | 0.09 | 0.08 | 0.01 | -0.03 | -0.08 | -0.06 |
| Weighted Avg Shares Out | 1.38B | 1.37B | 1.24B | 1.21B | 1.17B | 1.06B | 1.03B | 1.03B | 621.36M |
| Weighted Avg Shares Out (Dil) | 1.38B | 1.38B | 1.27B | 1.24B | 1.20B | 1.18B | 1.03B | 1.03B | 621.36M |
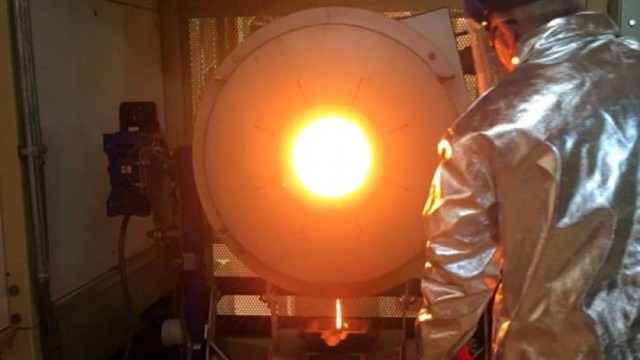
Perseus Mining's encouraging drilling results continue to demonstrate growth potential across gold projects in Côte d'Ivoire
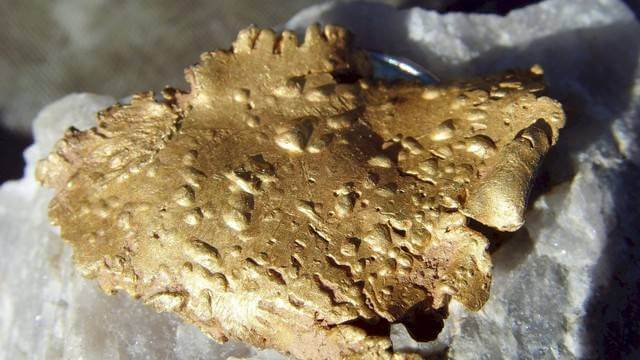
Perseus Mining's encouraging drilling results continue to demonstrate growth potential across gold projects in Côte d'Ivoire

Perseus Mining named “top pick” by Cannacord

Perseus Mining's positive outlook makes this a gold sector standout: Canaccord Genuity

Perseus Mining reports another record quarter with gold production exceeding top end of guidance

Perseus Mining Ltd (PMNXF) CEO Jeffrey Quartermaine on Q4 2021 Results - Earnings Call Transcript

Bellevue Gold, Perseus Mining and Red River Resources among Canaccord's top picks

Mako Gold receives strong show of support with Perseus becoming cornerstone shareholder

Perseus Mining strengthens board and improves gender diversity with appointment of Amber Banfield

Perseus Mining Strengthens Board With New Appointment
Source: https://incomestatements.info
Category: Stock Reports
