See more : Indbank Merchant Banking Services Limited (INDBANK.NS) Income Statement Analysis – Financial Results
Complete financial analysis of Polestar Automotive Holding UK PLC (PSNY) income statement, including revenue, profit margins, EPS and key performance metrics. Get detailed insights into the financial performance of Polestar Automotive Holding UK PLC, a leading company in the Auto – Manufacturers industry within the Consumer Cyclical sector.
- Medicus Pharma Ltd. Common Stock (MDCX) Income Statement Analysis – Financial Results
- Robust Hotels Limited (RHL.BO) Income Statement Analysis – Financial Results
- Mid-Atlantic Home Health Network, Inc. (MAHN) Income Statement Analysis – Financial Results
- Guotai Junan Securities Co., Ltd. (2611.HK) Income Statement Analysis – Financial Results
- OMRON Corporation (OMRNF) Income Statement Analysis – Financial Results
Polestar Automotive Holding UK PLC (PSNY)
About Polestar Automotive Holding UK PLC
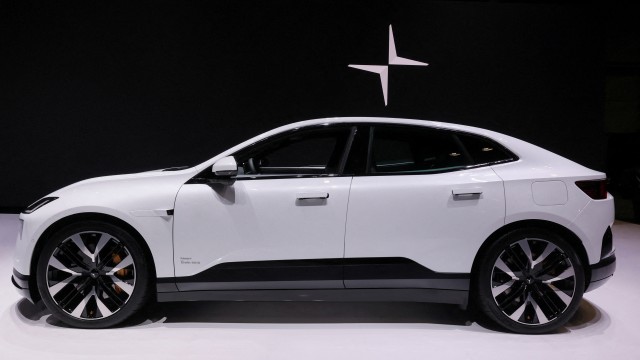
Polestar Automotive Holding UK PLC manufactures and sells premium electric vehicles. The company was founded in 2017 and is headquartered in Gothenburg, Sweden.
| Metric | 2023 | 2022 | 2021 | 2020 | 2019 |
|---|---|---|---|---|---|
| Revenue | 2.38B | 2.46B | 1.34B | 610.25M | 92.42M |
| Cost of Revenue | 2.79B | 2.34B | 1.34B | 553.72M | 39.79M |
| Gross Profit | -413.08M | 119.44M | 860.00K | 56.52M | 52.63M |
| Gross Profit Ratio | -17.37% | 4.85% | 0.06% | 9.26% | 56.94% |
| Research & Development | 158.41M | 170.99M | 232.92M | 183.85M | 34.39M |
| General & Administrative | 0.00 | 864.60M | 714.72M | 314.93M | 210.57M |
| Selling & Marketing | 0.00 | 0.00 | 0.00 | 0.00 | 0.00 |
| SG&A | 949.68M | 864.60M | 714.72M | 314.93M | 210.57M |
| Other Expenses | -41.20M | -2.18M | -1.25M | 712.00K | -425.00K |
| Operating Expenses | 1.07B | 1.03B | 946.40M | 499.49M | 244.53M |
| Cost & Expenses | 3.86B | 3.38B | 2.28B | 1.05B | 284.32M |
| Interest Income | 32.28M | 8.55M | 1.40M | 3.20M | 13.29M |
| Interest Expense | 206.48M | 108.44M | 45.24M | 26.50M | 18.94M |
| Depreciation & Amortization | 115.01M | 158.39M | 239.16M | 216.08M | 32.55M |
| EBITDA | -809.90M | -213.10M | -722.71M | -226.89M | -148.32M |
| EBITDA Ratio | -34.05% | -29.26% | -52.72% | -36.66% | -160.50% |
| Operating Income | -1.48B | -913.96M | -945.54M | -442.97M | -191.91M |
| Operating Income Ratio | -62.22% | -37.12% | -70.71% | -72.59% | -207.66% |
| Total Other Income/Expenses | 278.00M | 836.10M | -61.58M | -30.84M | -4.97M |
| Income Before Tax | -1.20B | -449.01M | -1.01B | -471.32M | -195.96M |
| Income Before Tax Ratio | -50.53% | -18.24% | -75.32% | -77.24% | -212.04% |
| Income Tax Expense | -7.14M | 16.78M | 336.00K | 13.54M | 2.02M |
| Net Income | -1.19B | -465.79M | -1.01B | -484.86M | -197.98M |
| Net Income Ratio | -50.23% | -18.92% | -75.34% | -79.45% | -214.22% |
| EPS | -0.57 | -0.23 | -0.48 | -0.23 | -0.09 |
| EPS Diluted | -0.57 | -0.22 | -0.48 | -0.23 | -0.09 |
| Weighted Avg Shares Out | 2.10B | 2.03B | 2.12B | 1.68B | 2.12B |
| Weighted Avg Shares Out (Dil) | 2.11B | 2.11B | 2.12B | 1.68B | 2.12B |

Why Rivian, Polestar, and Lucid Stocks All Dropped Today

Swedish EV maker Polestar confirms delay in Q1 earnings report

Polestar (PSNY) Faces Delisting Risk on Delayed Annual Filing

The Biden Bombshell: 3 EV Stocks on the Chopping Block Due to China Tariffs

Swedish EV maker Polestar gets Nasdaq notice on potential de-listing

Polestar Acknowledges Receipt of Deficiency Notice From Nasdaq

Just one company sells Chinese-made EVs in the U.S. Here's how it's navigating Biden's new tariffs.

Could Polestar Stock Be the Biggest Loser as Biden Levies New Tariffs on Chinese EVs?

Dump These 3 Dimming EV Stocks Before It's Too Late

Stock Market Crash Warning: Don't Get Caught Holding These 3 EV Stocks
Source: https://incomestatements.info
Category: Stock Reports
