See more : Studio Retail Group plc (STU.L) Income Statement Analysis – Financial Results
Complete financial analysis of REE Automotive Ltd. (REE) income statement, including revenue, profit margins, EPS and key performance metrics. Get detailed insights into the financial performance of REE Automotive Ltd., a leading company in the Auto – Recreational Vehicles industry within the Consumer Cyclical sector.
- Direct Finance of Direct Group (2006) Ltd (DIFI.TA) Income Statement Analysis – Financial Results
- Novarese, Inc. (9160.T) Income Statement Analysis – Financial Results
- PT Prima Cakrawala Abadi Tbk (PCAR.JK) Income Statement Analysis – Financial Results
- Stellantis N.V. (8TI.DE) Income Statement Analysis – Financial Results
- PT Asuransi Ramayana Tbk (ASRM.JK) Income Statement Analysis – Financial Results
REE Automotive Ltd. (REE)
About REE Automotive Ltd.
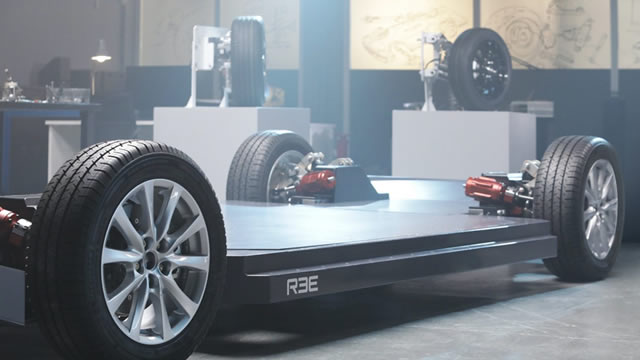
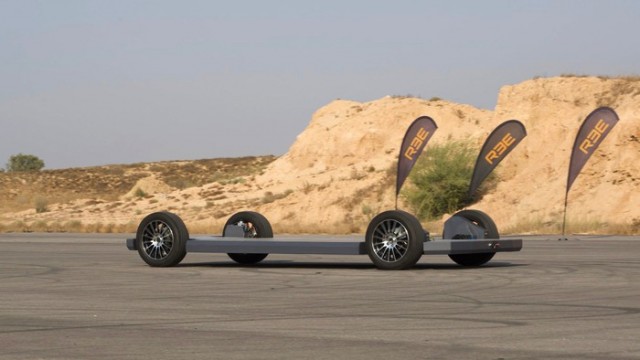
REE Automotive Ltd. operates in the e-mobility business. The company develops REEcorner technology, which integrates vehicle drive components, including steering, braking, suspension, powertrain, and control into the arch of the wheel. The company also develops REEboard, a flat and modular EV chassis. The company is headquartered in Herzliya, Israel.
| Metric | 2023 | 2022 | 2021 | 2020 | 2019 |
|---|---|---|---|---|---|
| Revenue | 1.61M | 0.00 | 6.00K | 388.00K | 681.00K |
| Cost of Revenue | 9.07M | 547.00K | 995.00K | 647.00K | 490.00K |
| Gross Profit | -7.46M | -547.00K | -989.00K | -259.00K | 191.00K |
| Gross Profit Ratio | -464.12% | 0.00% | -16,483.33% | -66.75% | 28.05% |
| Research & Development | 82.66M | 78.23M | 252.42M | 29.59M | 7.04M |
| General & Administrative | 0.00 | 0.00 | 0.00 | 0.00 | 0.00 |
| Selling & Marketing | 0.00 | 0.00 | 0.00 | 0.00 | 0.00 |
| SG&A | 29.77M | 49.20M | 262.08M | 38.25M | 7.18M |
| Other Expenses | 0.00 | 0.00 | 0.00 | 0.00 | 0.00 |
| Operating Expenses | 112.43M | 127.43M | 514.51M | 67.84M | 14.22M |
| Cost & Expenses | 121.50M | 127.97M | 515.50M | 68.49M | 14.71M |
| Interest Income | 4.35M | 2.79M | 423.00K | 409.00K | 1.83M |
| Interest Expense | 0.00 | -41.82M | 3.00K | -3.00K | 0.00 |
| Depreciation & Amortization | 5.80M | 4.91M | 484.00K | 166.00K | 82.00K |
| EBITDA | -114.09M | -100.76M | -503.57M | -67.93M | -13.94M |
| EBITDA Ratio | -7,095.21% | 0.00% | -8,767,266.67% | -17,501.29% | -2,047.43% |
| Operating Income | -119.89M | -127.97M | -515.50M | -68.10M | -14.03M |
| Operating Income Ratio | -7,455.97% | 0.00% | -8,591,600.00% | -17,551.03% | -2,059.47% |
| Total Other Income/Expenses | 4.32M | 22.30M | 11.45M | 385.00K | 1.83M |
| Income Before Tax | -115.57M | -105.67M | -504.05M | -67.71M | -12.20M |
| Income Before Tax Ratio | -7,187.06% | 0.00% | -8,400,816.67% | -17,451.80% | -1,790.75% |
| Income Tax Expense | -1.36M | 1.75M | 1.28M | -385.00K | -1.83M |
| Net Income | -114.21M | -107.42M | -505.33M | -67.33M | -10.37M |
| Net Income Ratio | -7,102.49% | 0.00% | -8,422,166.67% | -17,352.58% | -1,522.03% |
| EPS | -11.32 | -10.98 | -64.34 | -80.29 | -1.35 |
| EPS Diluted | -11.32 | -10.98 | -64.34 | -80.29 | -1.35 |
| Weighted Avg Shares Out | 10.09M | 9.78M | 7.85M | 838.54K | 7.66M |
| Weighted Avg Shares Out (Dil) | 10.09M | 9.78M | 7.85M | 838.54K | 7.66M |

REE Automotive, Ltd. Announces Date for Fourth Quarter 2021 Financial Results Release and Conference Call

REE Automotive to Participate in Leading Investor Conferences in Q1 2022

Why Shares of Lucid and Nio Sank Today, While an EV Start-Up Stock Jumped

REE Automotive Commences Trials Of Electric P7 Modular Platform

REE Stock Alert: What Is Going on With REE Automotive Today?

Why Shares of EV Company Ree Automotive Soared Today

5 Reddit Penny Stocks To Watch This Week

REE Automotive Drops on Larger-Than-Expected Loss

REE Automotive Ltd. (REE) CEO Daniel Barel on Q3 2021 Results - Earnings Call Transcript

REE Automotive Unveils New EV Chassis, Reports Third-Quarter Loss Of $414.9 Million
Source: https://incomestatements.info
Category: Stock Reports
