See more : Manulife Financial Corporation (0V5H.L) Income Statement Analysis – Financial Results
Complete financial analysis of Renforth Resources Inc. (RFHRF) income statement, including revenue, profit margins, EPS and key performance metrics. Get detailed insights into the financial performance of Renforth Resources Inc., a leading company in the Gold industry within the Basic Materials sector.
- Nova Lithium Corp. (NVALF) Income Statement Analysis – Financial Results
- Redwoods Acquisition Corp. (RWODU) Income Statement Analysis – Financial Results
- Avicanna Inc. (AVCNF) Income Statement Analysis – Financial Results
- Interfor Corporation (IFSPF) Income Statement Analysis – Financial Results
- Miza II Resources Inc. (MIA.CN) Income Statement Analysis – Financial Results
Renforth Resources Inc. (RFHRF)
About Renforth Resources Inc.
Renforth Resources Inc. engages in the acquisition, exploration, and development of mineral properties in Canada. It owns interests in the Surimeau District battery metals property in Quebec; Parbec gold deposit, a surface gold deposit in Malartic, Quebec; the Malartic West property, the site of a copper/silver discovery; and the Nixon-Bartleman property that hosts gold located to the west of Timmins Ontario. The company was formerly known as Wycliffe Resources Inc. Renforth Resources Inc. is headquartered in Pickering, Canada.
| Metric | 2023 | 2022 | 2021 | 2020 | 2019 | 2018 | 2017 | 2016 | 2015 | 2014 | 2013 | 2012 | 2011 | 2010 | 2009 | 2008 |
|---|---|---|---|---|---|---|---|---|---|---|---|---|---|---|---|---|
| Revenue | 0.00 | 0.00 | 0.00 | 0.00 | 0.00 | 0.00 | 0.00 | 0.00 | 0.00 | 0.00 | 0.00 | 0.00 | 0.00 | 0.00 | 0.00 | 0.00 |
| Cost of Revenue | 0.00 | 0.00 | 0.00 | 0.00 | 0.00 | 0.00 | 0.00 | 0.00 | 0.00 | 0.00 | 0.00 | 0.00 | 0.00 | 0.00 | 0.00 | 0.00 |
| Gross Profit | 0.00 | 0.00 | 0.00 | 0.00 | 0.00 | 0.00 | 0.00 | 0.00 | 0.00 | 0.00 | 0.00 | 0.00 | 0.00 | 0.00 | 0.00 | 0.00 |
| Gross Profit Ratio | 0.00% | 0.00% | 0.00% | 0.00% | 0.00% | 0.00% | 0.00% | 0.00% | 0.00% | 0.00% | 0.00% | 0.00% | 0.00% | 0.00% | 0.00% | 0.00% |
| Research & Development | 0.00 | 0.00 | 0.00 | 0.00 | 0.00 | 0.00 | 0.00 | 0.00 | 0.00 | 0.00 | 0.00 | 0.00 | 0.00 | 0.00 | 0.00 | 0.00 |
| General & Administrative | 599.79K | 1.03M | 1.45M | 1.06M | 489.32K | 821.95K | 341.38K | 267.01K | 204.26K | 241.29K | 263.19K | 300.38K | 526.33K | 663.71K | 789.79K | 1.54M |
| Selling & Marketing | 1.75M | 0.00 | 0.00 | 0.00 | 0.00 | 0.00 | 0.00 | 0.00 | 0.00 | 0.00 | 0.00 | 0.00 | 0.00 | 0.00 | 0.00 | 0.00 |
| SG&A | 2.35M | 1.03M | 1.45M | 1.06M | 489.32K | 821.95K | 341.38K | 267.01K | 204.26K | 241.29K | 263.19K | 300.38K | 526.33K | 663.71K | 789.79K | 1.54M |
| Other Expenses | 0.00 | 268.01K | 1.74M | 270.99K | 9.61K | 434.20K | 0.00 | 4.00K | 0.00 | 0.00 | 0.00 | 0.00 | 0.00 | 0.00 | 7.04K | 61.80K |
| Operating Expenses | 2.35M | 2.82M | 4.07M | 1.06M | 489.32K | 821.95K | 341.38K | 267.01K | 204.26K | 241.29K | 263.19K | 300.38K | 527.23K | 663.71K | 789.79K | 1.54M |
| Cost & Expenses | 2.35M | 2.82M | 4.07M | 1.06M | 489.32K | 821.95K | 341.38K | 267.01K | 204.26K | 241.29K | 263.19K | 300.38K | 527.23K | 663.71K | 789.79K | 1.54M |
| Interest Income | 6.16K | 0.00 | 0.00 | 0.00 | 0.00 | 0.00 | 0.00 | 0.00 | 0.00 | 0.00 | 224.00 | 841.00 | 1.46K | 2.19K | 7.04K | 0.00 |
| Interest Expense | 0.00 | 0.00 | 0.00 | 0.00 | 0.00 | 0.00 | 0.00 | 0.00 | 0.00 | 0.00 | 0.00 | 0.00 | 0.00 | 1.54K | 802.00 | 1.41K |
| Depreciation & Amortization | 2.35M | 2.82M | 4.07M | 3.49M | 489.32K | 821.95K | 348.00K | 267.01K | 0.29 | 291.00 | 1.81K | 889.00 | 908.00 | 1.07K | 0.00 | 0.00 |
| EBITDA | 0.00 | 0.00 | 0.00 | 0.00 | 0.00 | 0.00 | 0.00 | 0.00 | -203.97K | -338.45K | 49.59K | 4.17M | -209.50K | -661.52K | -782.75K | -1.48M |
| EBITDA Ratio | 0.00% | 0.00% | 0.00% | 0.00% | 0.00% | 0.00% | 0.00% | 0.00% | 0.00% | 0.00% | 0.00% | 0.00% | 0.00% | 0.00% | 0.00% | 0.00% |
| Operating Income | -2.35M | -1.71M | -2.98M | -1.84M | -489.32K | -982.63K | -334.75K | -276.01K | -405.68K | -338.74K | 47.78K | 4.17M | -210.41K | -661.52K | -782.75K | -1.48M |
| Operating Income Ratio | 0.00% | 0.00% | 0.00% | 0.00% | 0.00% | 0.00% | 0.00% | 0.00% | 0.00% | 0.00% | 0.00% | 0.00% | 0.00% | 0.00% | 0.00% | 0.00% |
| Total Other Income/Expenses | 209.43K | -842.46K | 649.46K | 4.85M | 9.61K | 594.88K | -1.00 | 9.00K | 402.85K | 97.45K | -310.74K | -8.94M | -632.19K | -1.54K | 7.04K | -1.41K |
| Income Before Tax | -2.14M | -3.66M | -3.42M | -21.35K | -479.71K | -227.06K | -348.00K | -258.01K | -2.83K | -143.85K | -573.92K | -4.77M | -842.60K | -663.07K | -783.55K | -1.48M |
| Income Before Tax Ratio | 0.00% | 0.00% | 0.00% | 0.00% | 0.00% | 0.00% | 0.00% | 0.00% | 0.00% | 0.00% | 0.00% | 0.00% | 0.00% | 0.00% | 0.00% | 0.00% |
| Income Tax Expense | 0.00 | 1.11M | 1.09M | 196.00K | -489.32 | -161.50K | -1.00 | -9.27K | -201.43K | -97.45K | -4.49K | -38.96K | 315.37K | -1.07K | 0.00 | -906.40K |
| Net Income | -2.14M | -3.66M | -3.42M | -217.35K | -479.71K | -227.06K | -348.00K | -258.01K | -2.83K | -143.85K | -569.43K | -4.73M | -842.60K | -663.07K | -783.55K | -576.62K |
| Net Income Ratio | 0.00% | 0.00% | 0.00% | 0.00% | 0.00% | 0.00% | 0.00% | 0.00% | 0.00% | 0.00% | 0.00% | 0.00% | 0.00% | 0.00% | 0.00% | 0.00% |
| EPS | -0.01 | -0.01 | -0.01 | 0.00 | 0.00 | 0.00 | 0.00 | 0.00 | 0.00 | 0.00 | -0.02 | -0.22 | -0.05 | -0.05 | -0.07 | -0.05 |
| EPS Diluted | -0.01 | -0.01 | -0.01 | 0.00 | 0.00 | 0.00 | 0.00 | 0.00 | 0.00 | 0.00 | -0.02 | -0.22 | -0.05 | -0.05 | -0.07 | -0.05 |
| Weighted Avg Shares Out | 213.83M | 288.38M | 260.95M | 222.41M | 175.89M | 160.88M | 124.50M | 71.50M | 54.79M | 43.14M | 31.98M | 21.58M | 18.63M | 13.45M | 11.01M | 10.57M |
| Weighted Avg Shares Out (Dil) | 327.53M | 288.38M | 260.95M | 290.66M | 175.89M | 160.88M | 124.50M | 71.50M | 54.79M | 43.14M | 31.98M | 21.58M | 18.63M | 13.45M | 11.01M | 10.57M |

Renforth Resources highlights success of ongoing drill program including visual mineralization
Renforth Resources begins winter drilling program at polymetallic mineralized system in Quebec

Renforth Resources says positive drill results advance its Surimeau nickel polymetallic battery metals property in Quebec
Renforth Resources issues update on exploration at Surimeau
Renforth Resources planning drill program in Q1 next year targeting western anomaly at Victoria nickel target at Surimeau
Renforth Resources intersects surface battery metals mineralisation in Lalonde channeling

Renforth Resources raises $1.5 million in oversubscribed private placement
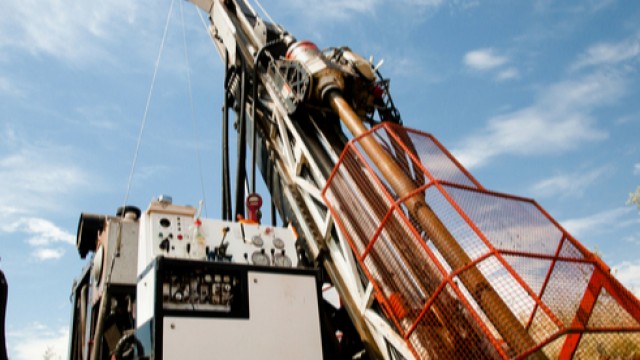
Renforth Resources kicks off new drill program at its Surimeau property in Quebec
Renforth Resources shares jump on latest exploration findings from its Lalonde nickel structure in Quebec

Renforth Resources closes first tranche of C$1M placement for upcoming Surimeau drill program
Source: https://incomestatements.info
Category: Stock Reports
