See more : WiSoL CO.,LTD. (122990.KQ) Income Statement Analysis – Financial Results
Complete financial analysis of Renforth Resources Inc. (RFHRF) income statement, including revenue, profit margins, EPS and key performance metrics. Get detailed insights into the financial performance of Renforth Resources Inc., a leading company in the Gold industry within the Basic Materials sector.
- GTPL Hathway Limited (GTPL.BO) Income Statement Analysis – Financial Results
- Innocorp Limited (INNOCORP.BO) Income Statement Analysis – Financial Results
- CIB Marine Bancshares, Inc. (CIBH) Income Statement Analysis – Financial Results
- Kerry Properties Limited (KRYPF) Income Statement Analysis – Financial Results
- China Coal Xinji Energy Co.,Ltd (601918.SS) Income Statement Analysis – Financial Results
Renforth Resources Inc. (RFHRF)
About Renforth Resources Inc.
Renforth Resources Inc. engages in the acquisition, exploration, and development of mineral properties in Canada. It owns interests in the Surimeau District battery metals property in Quebec; Parbec gold deposit, a surface gold deposit in Malartic, Quebec; the Malartic West property, the site of a copper/silver discovery; and the Nixon-Bartleman property that hosts gold located to the west of Timmins Ontario. The company was formerly known as Wycliffe Resources Inc. Renforth Resources Inc. is headquartered in Pickering, Canada.
| Metric | 2023 | 2022 | 2021 | 2020 | 2019 | 2018 | 2017 | 2016 | 2015 | 2014 | 2013 | 2012 | 2011 | 2010 | 2009 | 2008 |
|---|---|---|---|---|---|---|---|---|---|---|---|---|---|---|---|---|
| Revenue | 0.00 | 0.00 | 0.00 | 0.00 | 0.00 | 0.00 | 0.00 | 0.00 | 0.00 | 0.00 | 0.00 | 0.00 | 0.00 | 0.00 | 0.00 | 0.00 |
| Cost of Revenue | 0.00 | 0.00 | 0.00 | 0.00 | 0.00 | 0.00 | 0.00 | 0.00 | 0.00 | 0.00 | 0.00 | 0.00 | 0.00 | 0.00 | 0.00 | 0.00 |
| Gross Profit | 0.00 | 0.00 | 0.00 | 0.00 | 0.00 | 0.00 | 0.00 | 0.00 | 0.00 | 0.00 | 0.00 | 0.00 | 0.00 | 0.00 | 0.00 | 0.00 |
| Gross Profit Ratio | 0.00% | 0.00% | 0.00% | 0.00% | 0.00% | 0.00% | 0.00% | 0.00% | 0.00% | 0.00% | 0.00% | 0.00% | 0.00% | 0.00% | 0.00% | 0.00% |
| Research & Development | 0.00 | 0.00 | 0.00 | 0.00 | 0.00 | 0.00 | 0.00 | 0.00 | 0.00 | 0.00 | 0.00 | 0.00 | 0.00 | 0.00 | 0.00 | 0.00 |
| General & Administrative | 599.79K | 1.03M | 1.45M | 1.06M | 489.32K | 821.95K | 341.38K | 267.01K | 204.26K | 241.29K | 263.19K | 300.38K | 526.33K | 663.71K | 789.79K | 1.54M |
| Selling & Marketing | 1.75M | 0.00 | 0.00 | 0.00 | 0.00 | 0.00 | 0.00 | 0.00 | 0.00 | 0.00 | 0.00 | 0.00 | 0.00 | 0.00 | 0.00 | 0.00 |
| SG&A | 2.35M | 1.03M | 1.45M | 1.06M | 489.32K | 821.95K | 341.38K | 267.01K | 204.26K | 241.29K | 263.19K | 300.38K | 526.33K | 663.71K | 789.79K | 1.54M |
| Other Expenses | 0.00 | 268.01K | 1.74M | 270.99K | 9.61K | 434.20K | 0.00 | 4.00K | 0.00 | 0.00 | 0.00 | 0.00 | 0.00 | 0.00 | 7.04K | 61.80K |
| Operating Expenses | 2.35M | 2.82M | 4.07M | 1.06M | 489.32K | 821.95K | 341.38K | 267.01K | 204.26K | 241.29K | 263.19K | 300.38K | 527.23K | 663.71K | 789.79K | 1.54M |
| Cost & Expenses | 2.35M | 2.82M | 4.07M | 1.06M | 489.32K | 821.95K | 341.38K | 267.01K | 204.26K | 241.29K | 263.19K | 300.38K | 527.23K | 663.71K | 789.79K | 1.54M |
| Interest Income | 6.16K | 0.00 | 0.00 | 0.00 | 0.00 | 0.00 | 0.00 | 0.00 | 0.00 | 0.00 | 224.00 | 841.00 | 1.46K | 2.19K | 7.04K | 0.00 |
| Interest Expense | 0.00 | 0.00 | 0.00 | 0.00 | 0.00 | 0.00 | 0.00 | 0.00 | 0.00 | 0.00 | 0.00 | 0.00 | 0.00 | 1.54K | 802.00 | 1.41K |
| Depreciation & Amortization | 2.35M | 2.82M | 4.07M | 3.49M | 489.32K | 821.95K | 348.00K | 267.01K | 0.29 | 291.00 | 1.81K | 889.00 | 908.00 | 1.07K | 0.00 | 0.00 |
| EBITDA | 0.00 | 0.00 | 0.00 | 0.00 | 0.00 | 0.00 | 0.00 | 0.00 | -203.97K | -338.45K | 49.59K | 4.17M | -209.50K | -661.52K | -782.75K | -1.48M |
| EBITDA Ratio | 0.00% | 0.00% | 0.00% | 0.00% | 0.00% | 0.00% | 0.00% | 0.00% | 0.00% | 0.00% | 0.00% | 0.00% | 0.00% | 0.00% | 0.00% | 0.00% |
| Operating Income | -2.35M | -1.71M | -2.98M | -1.84M | -489.32K | -982.63K | -334.75K | -276.01K | -405.68K | -338.74K | 47.78K | 4.17M | -210.41K | -661.52K | -782.75K | -1.48M |
| Operating Income Ratio | 0.00% | 0.00% | 0.00% | 0.00% | 0.00% | 0.00% | 0.00% | 0.00% | 0.00% | 0.00% | 0.00% | 0.00% | 0.00% | 0.00% | 0.00% | 0.00% |
| Total Other Income/Expenses | 209.43K | -842.46K | 649.46K | 4.85M | 9.61K | 594.88K | -1.00 | 9.00K | 402.85K | 97.45K | -310.74K | -8.94M | -632.19K | -1.54K | 7.04K | -1.41K |
| Income Before Tax | -2.14M | -3.66M | -3.42M | -21.35K | -479.71K | -227.06K | -348.00K | -258.01K | -2.83K | -143.85K | -573.92K | -4.77M | -842.60K | -663.07K | -783.55K | -1.48M |
| Income Before Tax Ratio | 0.00% | 0.00% | 0.00% | 0.00% | 0.00% | 0.00% | 0.00% | 0.00% | 0.00% | 0.00% | 0.00% | 0.00% | 0.00% | 0.00% | 0.00% | 0.00% |
| Income Tax Expense | 0.00 | 1.11M | 1.09M | 196.00K | -489.32 | -161.50K | -1.00 | -9.27K | -201.43K | -97.45K | -4.49K | -38.96K | 315.37K | -1.07K | 0.00 | -906.40K |
| Net Income | -2.14M | -3.66M | -3.42M | -217.35K | -479.71K | -227.06K | -348.00K | -258.01K | -2.83K | -143.85K | -569.43K | -4.73M | -842.60K | -663.07K | -783.55K | -576.62K |
| Net Income Ratio | 0.00% | 0.00% | 0.00% | 0.00% | 0.00% | 0.00% | 0.00% | 0.00% | 0.00% | 0.00% | 0.00% | 0.00% | 0.00% | 0.00% | 0.00% | 0.00% |
| EPS | -0.01 | -0.01 | -0.01 | 0.00 | 0.00 | 0.00 | 0.00 | 0.00 | 0.00 | 0.00 | -0.02 | -0.22 | -0.05 | -0.05 | -0.07 | -0.05 |
| EPS Diluted | -0.01 | -0.01 | -0.01 | 0.00 | 0.00 | 0.00 | 0.00 | 0.00 | 0.00 | 0.00 | -0.02 | -0.22 | -0.05 | -0.05 | -0.07 | -0.05 |
| Weighted Avg Shares Out | 213.83M | 288.38M | 260.95M | 222.41M | 175.89M | 160.88M | 124.50M | 71.50M | 54.79M | 43.14M | 31.98M | 21.58M | 18.63M | 13.45M | 11.01M | 10.57M |
| Weighted Avg Shares Out (Dil) | 327.53M | 288.38M | 260.95M | 290.66M | 175.89M | 160.88M | 124.50M | 71.50M | 54.79M | 43.14M | 31.98M | 21.58M | 18.63M | 13.45M | 11.01M | 10.57M |
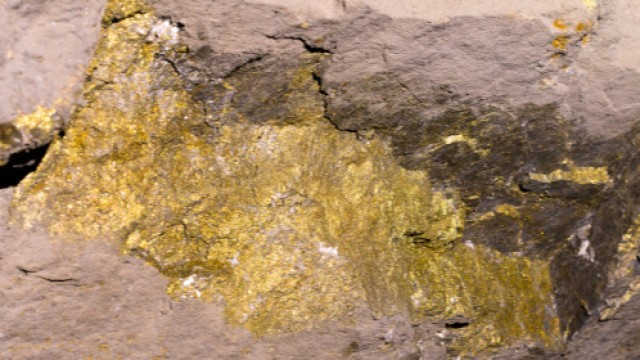
Renforth Resources intersects high-grade gold at its Parbec deposit in Quebec
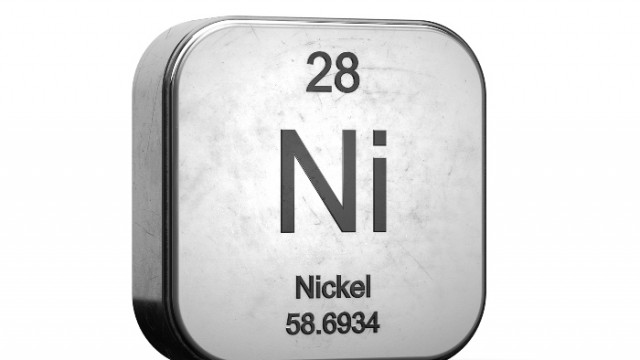
Renforth Resources discovers nickel on-surface at a new location on its Surimeau District Battery Metals property
Renforth Resources discovers nickel on-surface at a new location on its Surimeau District Battery Metals property
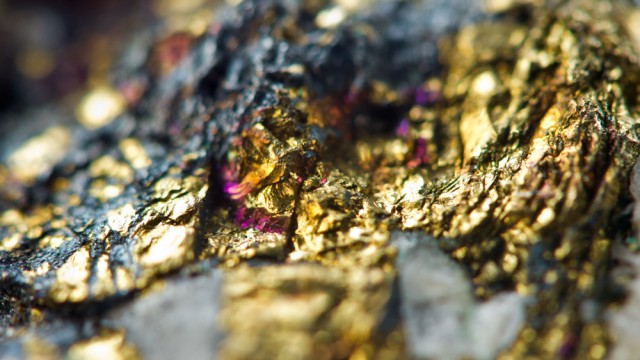
Renforth Resources poised to start exploration program at Surimeau project within week; reports additional Parbec gold drill results

Renforth Resources announces additional positive assay results at Parbec surface gold deposit in Quebec

Renforth Resources wraps up twin hole program at Parbec with results that support historical assays

Renforth Resources says it has fully divested in the Denain-Pershing property
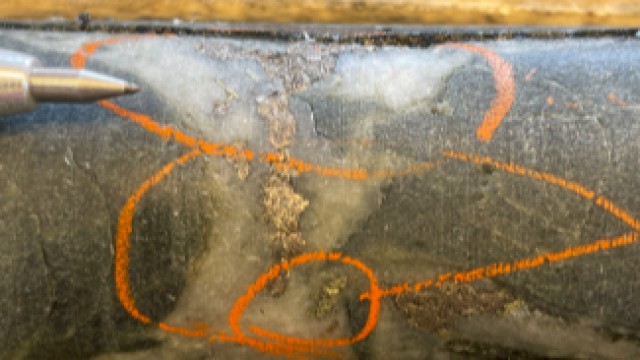
Renforth Resources discovers visible nickel, copper mineralization at its Surimeau project in Quebec
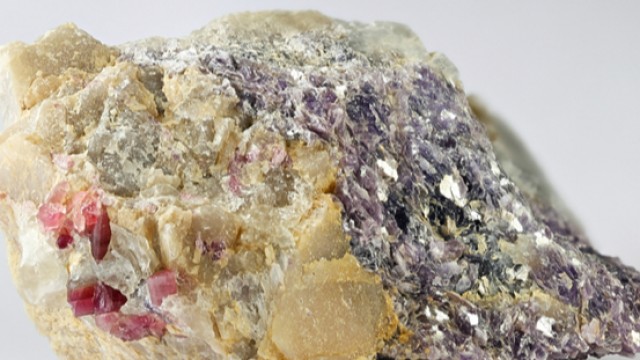
Renforth Resources completes first hole of June program at Surimeau; reports from another Parbec hole
Renforth Resources discovers more high-grade gold at its Parbec deposit in Quebec; provides Surimeau project update
Source: https://incomestatements.info
Category: Stock Reports
