See more : Caspian Sunrise plc (CASP.L) Income Statement Analysis – Financial Results
Complete financial analysis of Safran SA (SAFRF) income statement, including revenue, profit margins, EPS and key performance metrics. Get detailed insights into the financial performance of Safran SA, a leading company in the Aerospace & Defense industry within the Industrials sector.
- Hakuhodo DY Holdings Inc (HKUOF) Income Statement Analysis – Financial Results
- elumeo SE (ELB.DE) Income Statement Analysis – Financial Results
- Aspen Insurance Holdings Limited (AHL-PE) Income Statement Analysis – Financial Results
- YanGuFang International Group Co., Ltd. (YGF) Income Statement Analysis – Financial Results
- Broadcast Live Digital Corp. (BFLD) Income Statement Analysis – Financial Results
Safran SA (SAFRF)
About Safran SA
Safran SA, together with its subsidiaries, engages in the aerospace and defense businesses worldwide. The company operates through three segments: Aerospace Propulsion; Aircraft Equipment, Defense and Aerosystems; and Aircraft Interiors. The Aerospace Propulsion segment designs, develops, produces, and markets propulsion and mechanical power transmission systems for commercial aircraft, military transport, training and combat aircraft, civil and military helicopters, and drones. This segment also offers maintenance, repair, and overhaul services, as well as sells spare parts. The Aircraft Equipment, Defense and Aerosystems segment provides landing gears and brakes; and engine systems and equipment, such as thrust reversers and nacelles. This segment also offers avionics, such as flight controls and onboard information systems; security systems, including evacuation slides, emergency arresting systems, and oxygen masks; onboard computers and fuel systems; electrical power management systems and associated engineering services; and optronic equipment and sights, navigation equipment and sensors, infantry, and drones, as well as sells spare parts. Its products and services are used in civil and military aircraft, and helicopters. The Aircraft Interiors segment designs, develops, manufactures, and markets aircraft seats for passengers and crew; cabin equipment, overhead bins, class dividers, passenger service units, cabin interior solutions, chilling systems, galleys, electrical inserts, and trolleys and cargo equipment; and water distribution equipment, lavatories, air systems, and in-flight entertainment and connectivity systems. Safran SA was incorporated in 1924 and is headquartered in Paris, France.
| Metric | 2023 | 2022 | 2021 | 2020 | 2019 | 2018 | 2017 | 2016 | 2015 | 2014 | 2013 | 2012 | 2011 | 2010 | 2009 | 2008 | 2007 | 2006 | 2005 | 2004 |
|---|---|---|---|---|---|---|---|---|---|---|---|---|---|---|---|---|---|---|---|---|
| Revenue | 23.65B | 19.52B | 15.13B | 16.63B | 25.10B | 21.03B | 16.94B | 16.48B | 18.10B | 15.04B | 14.49B | 13.62B | 11.66B | 11.03B | 10.56B | 10.28B | 10.39B | 10.84B | 8.69B | 3.57B |
| Cost of Revenue | 12.60B | 10.15B | 7.86B | 9.02B | 13.58B | 12.00B | 9.01B | 8.43B | 9.01B | 7.82B | 7.79B | 7.26B | 6.34B | 6.05B | 6.46B | 5.90B | 6.62B | 6.67B | 5.75B | 2.37B |
| Gross Profit | 11.05B | 9.38B | 7.28B | 7.62B | 11.52B | 9.02B | 7.93B | 8.05B | 9.09B | 7.23B | 6.71B | 6.36B | 5.32B | 4.97B | 4.10B | 4.38B | 3.77B | 4.18B | 2.94B | 1.20B |
| Gross Profit Ratio | 46.71% | 48.04% | 48.09% | 45.79% | 45.89% | 42.92% | 46.83% | 48.85% | 50.20% | 48.04% | 46.27% | 46.71% | 45.63% | 45.10% | 38.84% | 42.60% | 36.28% | 38.51% | 33.85% | 33.59% |
| Research & Development | 0.00 | 1.06B | 838.00M | 905.00M | 1.28B | 1.12B | 1.22B | 1.47B | 1.52B | 1.42B | 1.19B | 667.00M | 0.00 | 0.00 | 0.00 | 0.00 | 0.00 | 0.00 | 0.00 | 0.00 |
| General & Administrative | 0.00 | 0.00 | 0.00 | 0.00 | 0.00 | 0.00 | 0.00 | 0.00 | 0.00 | 0.00 | 0.00 | 0.00 | 0.00 | 0.00 | 238.00M | 0.00 | 0.00 | 0.00 | 0.00 | 71.00M |
| Selling & Marketing | 0.00 | 0.00 | 0.00 | 0.00 | 0.00 | 0.00 | 0.00 | 0.00 | 0.00 | 0.00 | 0.00 | 0.00 | 0.00 | 0.00 | 0.00 | 0.00 | 0.00 | 0.00 | 0.00 | 0.00 |
| SG&A | 0.00 | 5.91B | 4.94B | 5.12B | 6.36B | 5.68B | 4.37B | 4.44B | 4.59B | 4.80B | 4.52B | 4.24B | 0.00 | 0.00 | 238.00M | 0.00 | 0.00 | 0.00 | 0.00 | 71.00M |
| Other Expenses | 7.74B | -450.00M | -182.00M | 30.00M | -259.00M | -313.00M | -321.00M | -232.00M | -269.00M | 0.00 | 0.00 | 0.00 | -108.00M | 0.00 | 552.00M | 0.00 | 62.00M | -8.00M | -6.00M | 0.00 |
| Operating Expenses | 7.74B | 6.66B | 6.10B | 6.19B | 7.94B | 6.97B | 5.23B | 4.90B | 6.09B | 5.71B | 5.31B | 5.07B | 4.42B | 4.01B | 4.00B | 3.78B | 3.77B | 4.24B | 3.25B | 1.00B |
| Cost & Expenses | 20.34B | 16.81B | 13.95B | 15.21B | 21.52B | 18.98B | 14.24B | 13.33B | 15.10B | 13.53B | 13.09B | 12.32B | 10.76B | 10.06B | 10.46B | 9.68B | 10.39B | 10.91B | 9.00B | 3.37B |
| Interest Income | 230.00M | 67.00M | 15.00M | 22.00M | 48.00M | 28.00M | 24.00M | 20.00M | 33.00M | 38.00M | 43.00M | 43.00M | 54.00M | 24.00M | -124.00M | -14.00M | 14.00M | 22.00M | -17.00M | 4.00M |
| Interest Expense | 140.00M | 94.00M | 109.00M | 108.00M | 120.00M | 121.00M | 116.00M | 142.00M | 121.00M | 135.00M | 135.00M | 187.00M | 42.00M | 60.00M | 38.00M | 716.00M | 45.00M | 22.00M | 29.00M | -4.00M |
| Depreciation & Amortization | 1.43B | 1.37B | 1.38B | 1.45B | 1.46B | 1.21B | 788.00M | 726.00M | 922.00M | 818.00M | 762.00M | 721.00M | 662.00M | 606.00M | 573.00M | 540.00M | 513.00M | 704.00M | 498.00M | 96.00M |
| EBITDA | 3.04B | -1.41B | 2.38B | 2.89B | 5.20B | 3.31B | 3.26B | 3.65B | 778.00M | 600.00M | 1.98B | 2.65B | 1.46B | 886.00M | 1.56B | 497.00M | 599.00M | 1.04B | -3.00M | 317.00M |
| EBITDA Ratio | 12.87% | -3.11% | 15.69% | 17.35% | 20.51% | 14.81% | 40.25% | 20.67% | 4.30% | 5.12% | 20.42% | 20.48% | 12.56% | 8.86% | 14.88% | 11.75% | 5.76% | 8.67% | 0.46% | 8.52% |
| Operating Income | 3.31B | 2.49B | 864.00M | 927.00M | 3.84B | 2.17B | 2.68B | 3.34B | 2.08B | 1.39B | 1.48B | 1.21B | 835.00M | 938.00M | 42.00M | 603.00M | 6.00M | -186.00M | -367.00M | 215.00M |
| Operating Income Ratio | 13.99% | 12.77% | 5.71% | 5.57% | 15.29% | 10.30% | 15.83% | 20.26% | 11.48% | 9.26% | 10.21% | 8.92% | 7.16% | 8.51% | 0.40% | 5.87% | 0.06% | -1.72% | -4.22% | 6.03% |
| Total Other Income/Expenses | 1.45B | -5.61B | -596.00M | -357.00M | -363.00M | -476.00M | 3.32B | -1.05B | -3.39B | -1.75B | 585.00M | 525.00M | -140.00M | -694.00M | 299.00M | -706.00M | -88.00M | 316.00M | -163.00M | 5.00M |
| Income Before Tax | 4.76B | -3.12B | 268.00M | 570.00M | 3.47B | 1.69B | 5.75B | 2.29B | -1.31B | -378.00M | 1.92B | 1.77B | 695.00M | 244.00M | 893.00M | -103.00M | 41.00M | 130.00M | -530.00M | 220.00M |
| Income Before Tax Ratio | 20.11% | -15.98% | 1.77% | 3.43% | 13.84% | 8.03% | 33.91% | 13.88% | -7.24% | -2.51% | 13.24% | 12.99% | 5.96% | 2.21% | 8.46% | -1.00% | 0.39% | 1.20% | -6.10% | 6.17% |
| Income Tax Expense | 1.24B | -694.00M | 200.00M | 184.00M | 962.00M | 348.00M | 1.72B | 398.00M | -508.00M | -292.00M | 650.00M | 442.00M | 201.00M | 14.00M | 235.00M | -142.00M | 75.00M | 109.00M | -226.00M | 66.00M |
| Net Income | 3.44B | -2.46B | 43.00M | 352.00M | 2.45B | 1.28B | 4.79B | 1.91B | -424.00M | -126.00M | 1.39B | 1.30B | 497.00M | 207.00M | 654.00M | -194.00M | 46.00M | 9.00M | -302.00M | 154.00M |
| Net Income Ratio | 14.56% | -12.60% | 0.28% | 2.12% | 9.75% | 6.10% | 28.28% | 11.58% | -2.34% | -0.84% | 9.57% | 9.56% | 4.26% | 1.88% | 6.19% | -1.89% | 0.44% | 0.08% | -3.47% | 4.32% |
| EPS | 8.07 | -5.76 | 0.10 | 0.83 | 5.69 | 2.98 | 11.68 | 4.58 | -1.02 | -0.30 | 3.33 | 3.14 | 1.23 | 0.52 | 1.64 | -0.48 | 0.11 | 0.02 | -0.86 | 0.86 |
| EPS Diluted | 7.98 | -5.76 | 0.10 | 0.80 | 5.63 | 2.94 | 11.47 | 4.50 | -1.02 | -0.30 | 3.33 | 3.13 | 1.22 | 0.51 | 1.63 | -0.48 | 0.11 | 0.02 | -0.86 | 0.86 |
| Weighted Avg Shares Out | 426.91M | 426.68M | 426.65M | 426.04M | 429.72M | 430.91M | 410.24M | 416.33M | 416.43M | 416.41M | 416.29M | 415.28M | 404.74M | 399.55M | 399.27M | 405.35M | 410.77M | 409.69M | 350.79M | 179.86M |
| Weighted Avg Shares Out (Dil) | 431.37M | 426.68M | 440.09M | 440.46M | 434.98M | 436.34M | 417.52M | 423.62M | 416.43M | 416.41M | 416.43M | 415.92M | 406.34M | 403.53M | 401.08M | 405.35M | 410.77M | 410.80M | 351.81M | 179.86M |

Safran Remains My Favorite Aerospace Supply Stock To Buy
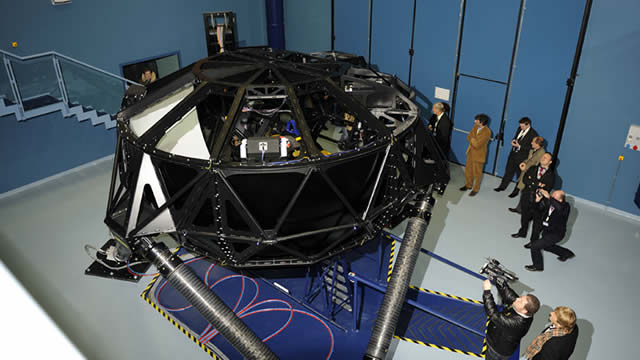
Safran in talks with MBDA over Roxel's stake, La Tribune reports
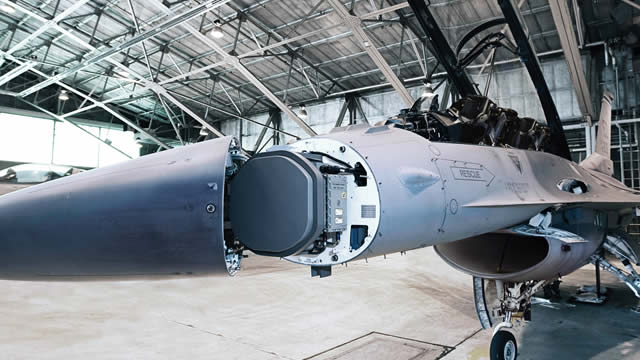
Safran buys AI firm Preligens for 220 million euros

France's Safran posts higher first-half profit

Safran: Defense Tailwinds Increase Competitive Advantage, Throwing Off ~$2Bn FCF

Striking workers, Safran reach agreement over pay in Montreal, Canada, says union
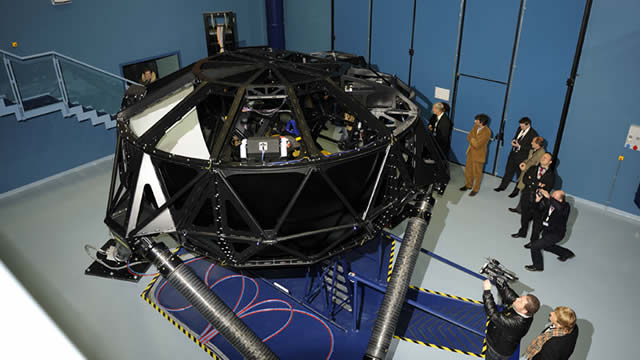
Five-week Quebec Safran strike adds to aircraft supply-chain woes
French jet engine maker Safran gets Italy's clearance to buy Microtecnica
Striking Canadian Safran workers make new offer to avert lengthy walkout, union says

Odysight.ai Receives Purchase Order from France-based Safran Aircraft Engines
Source: https://incomestatements.info
Category: Stock Reports
