See more : Vintron Informatics Limited (VINTRON.BO) Income Statement Analysis – Financial Results
Complete financial analysis of Safran SA (SAFRF) income statement, including revenue, profit margins, EPS and key performance metrics. Get detailed insights into the financial performance of Safran SA, a leading company in the Aerospace & Defense industry within the Industrials sector.
- Shandong Jinling Mining Co., Ltd. (000655.SZ) Income Statement Analysis – Financial Results
- Five-Star Business Finance Limited (FIVESTAR.BO) Income Statement Analysis – Financial Results
- PunaMusta Media Oyj (PUMU.HE) Income Statement Analysis – Financial Results
- PropTech Investment Corporation II (PTICW) Income Statement Analysis – Financial Results
- Mastery Education (PEDH) Income Statement Analysis – Financial Results
Safran SA (SAFRF)
About Safran SA
Safran SA, together with its subsidiaries, engages in the aerospace and defense businesses worldwide. The company operates through three segments: Aerospace Propulsion; Aircraft Equipment, Defense and Aerosystems; and Aircraft Interiors. The Aerospace Propulsion segment designs, develops, produces, and markets propulsion and mechanical power transmission systems for commercial aircraft, military transport, training and combat aircraft, civil and military helicopters, and drones. This segment also offers maintenance, repair, and overhaul services, as well as sells spare parts. The Aircraft Equipment, Defense and Aerosystems segment provides landing gears and brakes; and engine systems and equipment, such as thrust reversers and nacelles. This segment also offers avionics, such as flight controls and onboard information systems; security systems, including evacuation slides, emergency arresting systems, and oxygen masks; onboard computers and fuel systems; electrical power management systems and associated engineering services; and optronic equipment and sights, navigation equipment and sensors, infantry, and drones, as well as sells spare parts. Its products and services are used in civil and military aircraft, and helicopters. The Aircraft Interiors segment designs, develops, manufactures, and markets aircraft seats for passengers and crew; cabin equipment, overhead bins, class dividers, passenger service units, cabin interior solutions, chilling systems, galleys, electrical inserts, and trolleys and cargo equipment; and water distribution equipment, lavatories, air systems, and in-flight entertainment and connectivity systems. Safran SA was incorporated in 1924 and is headquartered in Paris, France.
| Metric | 2023 | 2022 | 2021 | 2020 | 2019 | 2018 | 2017 | 2016 | 2015 | 2014 | 2013 | 2012 | 2011 | 2010 | 2009 | 2008 | 2007 | 2006 | 2005 | 2004 |
|---|---|---|---|---|---|---|---|---|---|---|---|---|---|---|---|---|---|---|---|---|
| Revenue | 23.65B | 19.52B | 15.13B | 16.63B | 25.10B | 21.03B | 16.94B | 16.48B | 18.10B | 15.04B | 14.49B | 13.62B | 11.66B | 11.03B | 10.56B | 10.28B | 10.39B | 10.84B | 8.69B | 3.57B |
| Cost of Revenue | 12.60B | 10.15B | 7.86B | 9.02B | 13.58B | 12.00B | 9.01B | 8.43B | 9.01B | 7.82B | 7.79B | 7.26B | 6.34B | 6.05B | 6.46B | 5.90B | 6.62B | 6.67B | 5.75B | 2.37B |
| Gross Profit | 11.05B | 9.38B | 7.28B | 7.62B | 11.52B | 9.02B | 7.93B | 8.05B | 9.09B | 7.23B | 6.71B | 6.36B | 5.32B | 4.97B | 4.10B | 4.38B | 3.77B | 4.18B | 2.94B | 1.20B |
| Gross Profit Ratio | 46.71% | 48.04% | 48.09% | 45.79% | 45.89% | 42.92% | 46.83% | 48.85% | 50.20% | 48.04% | 46.27% | 46.71% | 45.63% | 45.10% | 38.84% | 42.60% | 36.28% | 38.51% | 33.85% | 33.59% |
| Research & Development | 0.00 | 1.06B | 838.00M | 905.00M | 1.28B | 1.12B | 1.22B | 1.47B | 1.52B | 1.42B | 1.19B | 667.00M | 0.00 | 0.00 | 0.00 | 0.00 | 0.00 | 0.00 | 0.00 | 0.00 |
| General & Administrative | 0.00 | 0.00 | 0.00 | 0.00 | 0.00 | 0.00 | 0.00 | 0.00 | 0.00 | 0.00 | 0.00 | 0.00 | 0.00 | 0.00 | 238.00M | 0.00 | 0.00 | 0.00 | 0.00 | 71.00M |
| Selling & Marketing | 0.00 | 0.00 | 0.00 | 0.00 | 0.00 | 0.00 | 0.00 | 0.00 | 0.00 | 0.00 | 0.00 | 0.00 | 0.00 | 0.00 | 0.00 | 0.00 | 0.00 | 0.00 | 0.00 | 0.00 |
| SG&A | 0.00 | 5.91B | 4.94B | 5.12B | 6.36B | 5.68B | 4.37B | 4.44B | 4.59B | 4.80B | 4.52B | 4.24B | 0.00 | 0.00 | 238.00M | 0.00 | 0.00 | 0.00 | 0.00 | 71.00M |
| Other Expenses | 7.74B | -450.00M | -182.00M | 30.00M | -259.00M | -313.00M | -321.00M | -232.00M | -269.00M | 0.00 | 0.00 | 0.00 | -108.00M | 0.00 | 552.00M | 0.00 | 62.00M | -8.00M | -6.00M | 0.00 |
| Operating Expenses | 7.74B | 6.66B | 6.10B | 6.19B | 7.94B | 6.97B | 5.23B | 4.90B | 6.09B | 5.71B | 5.31B | 5.07B | 4.42B | 4.01B | 4.00B | 3.78B | 3.77B | 4.24B | 3.25B | 1.00B |
| Cost & Expenses | 20.34B | 16.81B | 13.95B | 15.21B | 21.52B | 18.98B | 14.24B | 13.33B | 15.10B | 13.53B | 13.09B | 12.32B | 10.76B | 10.06B | 10.46B | 9.68B | 10.39B | 10.91B | 9.00B | 3.37B |
| Interest Income | 230.00M | 67.00M | 15.00M | 22.00M | 48.00M | 28.00M | 24.00M | 20.00M | 33.00M | 38.00M | 43.00M | 43.00M | 54.00M | 24.00M | -124.00M | -14.00M | 14.00M | 22.00M | -17.00M | 4.00M |
| Interest Expense | 140.00M | 94.00M | 109.00M | 108.00M | 120.00M | 121.00M | 116.00M | 142.00M | 121.00M | 135.00M | 135.00M | 187.00M | 42.00M | 60.00M | 38.00M | 716.00M | 45.00M | 22.00M | 29.00M | -4.00M |
| Depreciation & Amortization | 1.43B | 1.37B | 1.38B | 1.45B | 1.46B | 1.21B | 788.00M | 726.00M | 922.00M | 818.00M | 762.00M | 721.00M | 662.00M | 606.00M | 573.00M | 540.00M | 513.00M | 704.00M | 498.00M | 96.00M |
| EBITDA | 3.04B | -1.41B | 2.38B | 2.89B | 5.20B | 3.31B | 3.26B | 3.65B | 778.00M | 600.00M | 1.98B | 2.65B | 1.46B | 886.00M | 1.56B | 497.00M | 599.00M | 1.04B | -3.00M | 317.00M |
| EBITDA Ratio | 12.87% | -3.11% | 15.69% | 17.35% | 20.51% | 14.81% | 40.25% | 20.67% | 4.30% | 5.12% | 20.42% | 20.48% | 12.56% | 8.86% | 14.88% | 11.75% | 5.76% | 8.67% | 0.46% | 8.52% |
| Operating Income | 3.31B | 2.49B | 864.00M | 927.00M | 3.84B | 2.17B | 2.68B | 3.34B | 2.08B | 1.39B | 1.48B | 1.21B | 835.00M | 938.00M | 42.00M | 603.00M | 6.00M | -186.00M | -367.00M | 215.00M |
| Operating Income Ratio | 13.99% | 12.77% | 5.71% | 5.57% | 15.29% | 10.30% | 15.83% | 20.26% | 11.48% | 9.26% | 10.21% | 8.92% | 7.16% | 8.51% | 0.40% | 5.87% | 0.06% | -1.72% | -4.22% | 6.03% |
| Total Other Income/Expenses | 1.45B | -5.61B | -596.00M | -357.00M | -363.00M | -476.00M | 3.32B | -1.05B | -3.39B | -1.75B | 585.00M | 525.00M | -140.00M | -694.00M | 299.00M | -706.00M | -88.00M | 316.00M | -163.00M | 5.00M |
| Income Before Tax | 4.76B | -3.12B | 268.00M | 570.00M | 3.47B | 1.69B | 5.75B | 2.29B | -1.31B | -378.00M | 1.92B | 1.77B | 695.00M | 244.00M | 893.00M | -103.00M | 41.00M | 130.00M | -530.00M | 220.00M |
| Income Before Tax Ratio | 20.11% | -15.98% | 1.77% | 3.43% | 13.84% | 8.03% | 33.91% | 13.88% | -7.24% | -2.51% | 13.24% | 12.99% | 5.96% | 2.21% | 8.46% | -1.00% | 0.39% | 1.20% | -6.10% | 6.17% |
| Income Tax Expense | 1.24B | -694.00M | 200.00M | 184.00M | 962.00M | 348.00M | 1.72B | 398.00M | -508.00M | -292.00M | 650.00M | 442.00M | 201.00M | 14.00M | 235.00M | -142.00M | 75.00M | 109.00M | -226.00M | 66.00M |
| Net Income | 3.44B | -2.46B | 43.00M | 352.00M | 2.45B | 1.28B | 4.79B | 1.91B | -424.00M | -126.00M | 1.39B | 1.30B | 497.00M | 207.00M | 654.00M | -194.00M | 46.00M | 9.00M | -302.00M | 154.00M |
| Net Income Ratio | 14.56% | -12.60% | 0.28% | 2.12% | 9.75% | 6.10% | 28.28% | 11.58% | -2.34% | -0.84% | 9.57% | 9.56% | 4.26% | 1.88% | 6.19% | -1.89% | 0.44% | 0.08% | -3.47% | 4.32% |
| EPS | 8.07 | -5.76 | 0.10 | 0.83 | 5.69 | 2.98 | 11.68 | 4.58 | -1.02 | -0.30 | 3.33 | 3.14 | 1.23 | 0.52 | 1.64 | -0.48 | 0.11 | 0.02 | -0.86 | 0.86 |
| EPS Diluted | 7.98 | -5.76 | 0.10 | 0.80 | 5.63 | 2.94 | 11.47 | 4.50 | -1.02 | -0.30 | 3.33 | 3.13 | 1.22 | 0.51 | 1.63 | -0.48 | 0.11 | 0.02 | -0.86 | 0.86 |
| Weighted Avg Shares Out | 426.91M | 426.68M | 426.65M | 426.04M | 429.72M | 430.91M | 410.24M | 416.33M | 416.43M | 416.41M | 416.29M | 415.28M | 404.74M | 399.55M | 399.27M | 405.35M | 410.77M | 409.69M | 350.79M | 179.86M |
| Weighted Avg Shares Out (Dil) | 431.37M | 426.68M | 440.09M | 440.46M | 434.98M | 436.34M | 417.52M | 423.62M | 416.43M | 416.41M | 416.43M | 415.92M | 406.34M | 403.53M | 401.08M | 405.35M | 410.77M | 410.80M | 351.81M | 179.86M |

Safran SA (SAFRF) CEO Olivier Andries on Q4 2021 Results - Earnings Call Transcript
Aerospace supplier Safran's core profit rose 7.1% in 2021 - Reuters News
Curtiss-Wright (CW) to Buy Safran Aerosystems' Arm for $240M
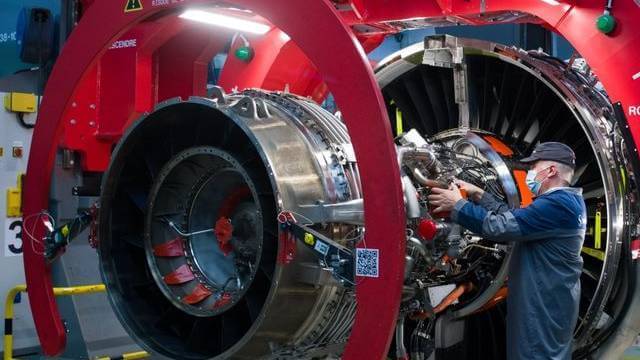
Jet maker Safran plans 12,000 hires in 2022 as air traffic recovers
Safran stands firm on jet output, reviews part of Zodiac
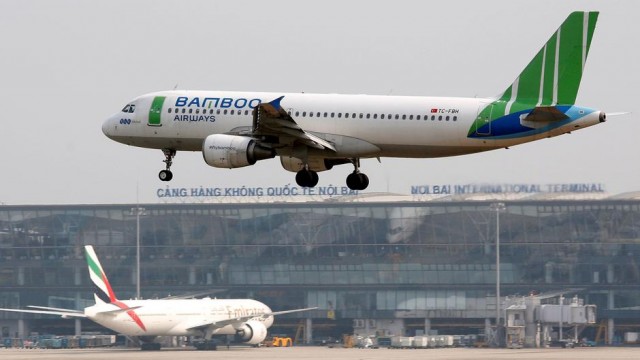
Vietnam's Bamboo Airways signs 1.73 billion euro supply deal with GE, Safran JV

AerCap Forms JV With Safran For Shannon Engine Support
Engine maker Safran renews concerns about Airbus output hopes

Safran SA (SAFRF) CEO Olivier Andriès on Q2 2021 Results - Earnings Call Transcript
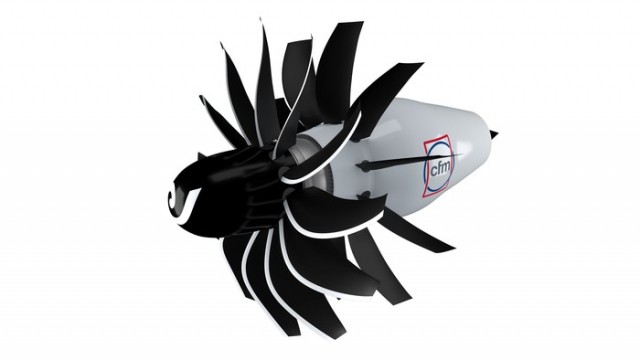
GE and Safran Trash Boeing CEO's Jet Engine Prediction
Source: https://incomestatements.info
Category: Stock Reports
