See more : Yunnan Yunwei Company Limited (600725.SS) Income Statement Analysis – Financial Results
Complete financial analysis of SDI Group plc (SDIIF) income statement, including revenue, profit margins, EPS and key performance metrics. Get detailed insights into the financial performance of SDI Group plc, a leading company in the Hardware, Equipment & Parts industry within the Technology sector.
- Basant Agro Tech (India) Limited (BASANTGL.BO) Income Statement Analysis – Financial Results
- Universal Tracking Solutions, Inc. (UTRK) Income Statement Analysis – Financial Results
- Novartis India Limited (NOVARTIND.BO) Income Statement Analysis – Financial Results
- Siam Wellness Group Public Company Limited (SPA.BK) Income Statement Analysis – Financial Results
- Ten Pao Group Holdings Limited (1979.HK) Income Statement Analysis – Financial Results
SDI Group plc (SDIIF)
About SDI Group plc
SDI Group plc, through its subsidiaries, designs and manufactures scientific and technology products based on digital imaging in the United Kingdom, rest of Europe, the United States, Asia, and internationally. It operates in two segments, Digital Imaging and Sensors & Control segments. The company offers sensitive camera for life science and industrial applications under the Atik Camera brand name; cameras for art conservation under the Opus Instruments brand name; and camera that have applications in astronomy and life science fields under the Quantum Scientific Imaging brand name. It also offers precision re-circulating chiller, cooler, and heat exchanger to control the thermal environment; and supplies chemical dosing and control system for manufacturing industries. It offers off-the-shelf and custom-made electrochemical sensor for water-based applications under the Sentek name; system and software for automated gel-based DNA and protein fluorescence/chemiluminescence imaging under the G:BOX and NuGenius brands; automated and manual system for microbiological testing in various applications; ProtoCOL 3, a system that is used for vaccine and antibiotic development in pharmaceutical company; and AutoCOL, develops and manufactures a range of automated colony counting and zone sizing product. It also offers clean air solution; cooling solution; metalwork solution for commercial and industrial sector; and oven, incubator, and other temperature controlled product. It designs, manufactures, and calibration of pressure, vacuum, and gas flow measurement instrument; and flowmeter and control instrumentation; and precision micropattern product, as well as water purification product and vacuum ovens under the Cyclon Water Still and Gallenkamp vacuum ovens brands. The company was formerly known as Scientific Digital Imaging plc and changed its name to SDI Group plc in November 2019. SDI Group plc was incorporated in 2007 and is based in Cambridge, the United Kingdom.
| Metric | 2024 | 2023 | 2022 | 2021 | 2020 | 2019 | 2018 | 2017 | 2016 | 2015 | 2014 | 2013 | 2012 | 2011 | 2010 | 2009 | 2008 | 2007 |
|---|---|---|---|---|---|---|---|---|---|---|---|---|---|---|---|---|---|---|
| Revenue | 65.85M | 67.58M | 49.66M | 35.08M | 24.50M | 17.43M | 14.50M | 10.75M | 8.47M | 6.96M | 7.04M | 7.67M | 7.17M | 7.29M | 7.19M | 6.75M | 5.73M | 5.65M |
| Cost of Revenue | 24.30M | 24.81M | 18.00M | 12.21M | 7.90M | 5.90M | 4.95M | 3.84M | 3.30M | 2.84M | 3.02M | 3.30M | 3.09M | 3.20M | 2.89M | 2.95M | 2.45M | 2.63M |
| Gross Profit | 41.55M | 42.77M | 31.66M | 22.87M | 16.60M | 11.53M | 9.54M | 6.91M | 5.18M | 4.12M | 4.02M | 4.36M | 4.08M | 4.09M | 4.29M | 3.81M | 3.28M | 3.02M |
| Gross Profit Ratio | 63.10% | 63.29% | 63.75% | 65.20% | 67.76% | 66.13% | 65.83% | 64.30% | 61.08% | 59.21% | 57.07% | 56.89% | 56.90% | 56.13% | 59.73% | 56.38% | 57.28% | 53.52% |
| Research & Development | 0.00 | 511.00K | 400.00K | 400.00K | 528.00K | 591.00K | 250.00K | 140.00K | 239.00K | 650.00K | 522.00K | 628.00K | 494.00K | 368.00K | 452.00K | 478.00K | 366.00K | 387.00K |
| General & Administrative | 11.18M | 10.62M | 0.00 | 0.00 | 0.00 | 0.00 | 7.47M | 5.69M | 4.44M | 3.73M | 3.89M | 4.06M | 3.93M | 4.16M | 3.95M | 3.54M | 0.00 | 0.00 |
| Selling & Marketing | 0.00 | 19.31M | 0.00 | 0.00 | 0.00 | 0.00 | 0.00 | 0.00 | 0.00 | 0.00 | 0.00 | 0.00 | 0.00 | 0.00 | 0.00 | 0.00 | 0.00 | 0.00 |
| SG&A | 11.18M | 29.93M | 19.51M | 14.99M | 11.74M | 7.93M | 7.47M | 5.69M | 4.44M | 3.73M | 3.89M | 4.06M | 3.93M | 4.16M | 3.95M | 3.54M | 0.00 | 0.00 |
| Other Expenses | 23.08M | 112.00K | 55.00K | 21.00K | 0.00 | 0.00 | 0.00 | 0.00 | 0.00 | 0.00 | 0.00 | 0.00 | -2.00K | 28.00K | 23.00K | -183.00K | 0.00 | 0.00 |
| Operating Expenses | 34.26M | 32.44M | 21.48M | 16.94M | 12.92M | 8.92M | 7.54M | 5.70M | 4.44M | 3.73M | 3.90M | 4.07M | 3.93M | 4.10M | 3.91M | 4.26M | 3.06M | 2.62M |
| Cost & Expenses | 58.56M | 57.25M | 39.48M | 29.15M | 20.82M | 14.82M | 12.49M | 9.53M | 7.74M | 6.57M | 6.92M | 7.37M | 7.02M | 7.30M | 6.80M | 7.21M | 5.51M | 5.25M |
| Interest Income | 0.00 | 0.00 | 0.00 | 0.00 | 0.00 | 0.00 | 0.00 | 0.00 | 0.00 | 0.00 | 0.00 | 0.00 | 1.00K | -8.00K | 3.00K | 5.00K | 10.00K | 2.00K |
| Interest Expense | 1.63M | 970.00K | 295.00K | 287.00K | 254.00K | 77.00K | 63.00K | 61.00K | 40.00K | 36.00K | 39.00K | 67.00K | 65.00K | 68.00K | 65.00K | 54.00K | 49.00K | 49.00K |
| Depreciation & Amortization | 2.68M | 4.26M | 2.77M | 2.56M | 2.02M | 1.21M | 1.08M | 769.00K | 663.00K | 571.00K | 595.00K | 492.00K | 457.00K | 379.00K | 295.00K | 196.00K | 230.00K | 214.00K |
| EBITDA | 9.97M | 13.18M | 12.95M | 8.49M | 5.17M | 3.22M | 2.55M | 1.58M | 1.03M | 644.00K | 339.00K | 772.00K | 529.00K | 285.00K | 612.00K | 295.00K | 461.00K | 560.00K |
| EBITDA Ratio | 15.14% | 21.59% | 26.08% | 24.21% | 23.26% | 21.87% | 21.25% | 18.47% | 16.45% | 13.75% | 9.18% | 10.25% | 8.58% | 3.91% | 8.52% | 4.37% | 7.96% | 9.92% |
| Operating Income | 7.29M | 6.81M | 10.18M | 5.93M | 3.51M | 2.20M | 1.78M | 964.00K | 536.00K | 59.00K | 1.00K | 280.00K | 84.00K | -94.00K | 319.00K | 106.00K | 221.00K | 346.00K |
| Operating Income Ratio | 11.07% | 10.08% | 20.50% | 16.91% | 14.33% | 12.61% | 12.25% | 8.97% | 6.33% | 0.85% | 0.01% | 3.65% | 1.17% | -1.29% | 4.44% | 1.57% | 3.86% | 6.13% |
| Total Other Income/Expenses | -1.63M | -970.00K | -295.00K | -287.00K | -254.00K | -77.00K | -63.00K | -61.00K | -40.00K | -36.00K | -39.00K | -83.00K | -64.00K | -68.00K | -62.00K | -49.00K | -39.00K | -47.00K |
| Income Before Tax | 5.66M | 5.84M | 9.88M | 5.64M | 3.26M | 2.12M | 1.71M | 903.00K | 496.00K | 23.00K | -38.00K | 213.00K | 20.00K | -162.00K | 257.00K | 57.00K | 182.00K | 299.00K |
| Income Before Tax Ratio | 8.60% | 8.64% | 19.90% | 16.09% | 13.29% | 12.17% | 11.82% | 8.40% | 5.85% | 0.33% | -0.54% | 2.78% | 0.28% | -2.22% | 3.58% | 0.84% | 3.18% | 5.29% |
| Income Tax Expense | 1.41M | 1.94M | 2.34M | 936.00K | 666.00K | 209.00K | 98.00K | 75.00K | -76.00K | -21.00K | 50.00K | 21.00K | 74.00K | 40.00K | -19.00K | 49.00K | 33.00K | -55.00K |
| Net Income | 4.23M | 3.87M | 7.54M | 4.71M | 2.59M | 1.91M | 1.62M | 828.00K | 571.00K | 44.00K | -38.00K | 192.00K | 20.00K | -202.00K | 276.00K | 8.00K | 149.00K | 354.00K |
| Net Income Ratio | 6.43% | 5.73% | 15.19% | 13.42% | 10.58% | 10.97% | 11.14% | 7.70% | 6.74% | 0.63% | -0.54% | 2.50% | 0.28% | -2.77% | 3.84% | 0.12% | 2.60% | 6.27% |
| EPS | 0.04 | 0.04 | 0.08 | 0.05 | 0.03 | 0.02 | 0.02 | 0.01 | 0.01 | 0.00 | 0.00 | 0.01 | 0.00 | -0.01 | 0.02 | 0.00 | 0.01 | 0.02 |
| EPS Diluted | 0.04 | 0.04 | 0.07 | 0.05 | 0.03 | 0.02 | 0.02 | 0.01 | 0.01 | 0.00 | 0.00 | 0.01 | 0.00 | -0.01 | 0.02 | 0.00 | 0.01 | 0.02 |
| Weighted Avg Shares Out | 105.25M | 102.76M | 100.12M | 97.85M | 97.28M | 91.21M | 89.39M | 70.97M | 48.70M | 28.90M | 24.47M | 18.32M | 17.99M | 17.66M | 16.52M | 15.84M | 15.43M | 16.66M |
| Weighted Avg Shares Out (Dil) | 105.25M | 104.80M | 104.26M | 102.80M | 101.21M | 93.33M | 90.11M | 72.62M | 49.58M | 28.90M | 24.47M | 18.98M | 19.03M | 17.66M | 18.94M | 18.51M | 17.01M | 16.66M |
Samsung SDI, Stellantis choose Indiana for second joint EV battery plant
Samsung SDI to invest $2 bln to build second joint battery plant in US with Stellantis
Stellantis, Samsung SDI set plan to build second US battery plant
GM teams with Samsung SDI to invest over $3 billion to build and EV battery plant in the U.S.
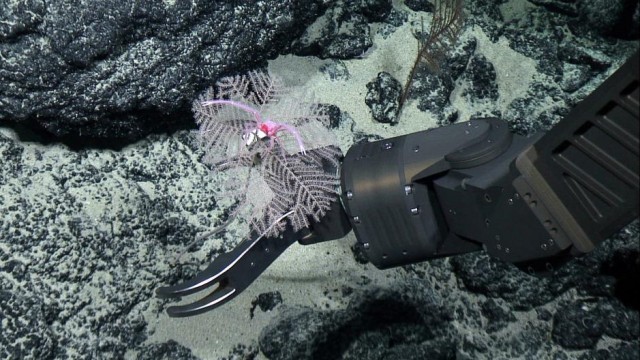
Google, BMW, Volvo, and Samsung SDI sign up to WWF call for temporary ban on deep-sea mining
Air Liquide Signs Long-term Supply Agreement With Steel Dynamics, Inc. (SDI) in The U.S.
Source: https://incomestatements.info
Category: Stock Reports
