See more : Tongling Nonferrous Metals Group Co.,Ltd. (000630.SZ) Income Statement Analysis – Financial Results
Complete financial analysis of Electrameccanica Vehicles Corp. (SOLO) income statement, including revenue, profit margins, EPS and key performance metrics. Get detailed insights into the financial performance of Electrameccanica Vehicles Corp., a leading company in the Auto – Manufacturers industry within the Consumer Cyclical sector.
- CK Infrastructure Holdings Limited (CKISF) Income Statement Analysis – Financial Results
- Jinchuan Group International Resources Co. Ltd (2362.HK) Income Statement Analysis – Financial Results
- ENENSYS Technologies SA (ALNN6.PA) Income Statement Analysis – Financial Results
- Foosung Co., Ltd. (093370.KS) Income Statement Analysis – Financial Results
- Acroud AB (publ) (ACROUD.ST) Income Statement Analysis – Financial Results
Electrameccanica Vehicles Corp. (SOLO)
About Electrameccanica Vehicles Corp.
Electrameccanica Vehicles Corp., a development-stage company, develops, manufactures, and sells electric vehicles in Canada. The company operates in two segments, Electric Vehicles and Custom Build Vehicles. Its flagship product is the SOLO, a single seat vehicle. The company is also developing Tofino, an all-electric two-seater roadster. It also develops and manufactures custom built vehicles. The company sells its vehicles online through electrameccanica.com, as well as through 17 retail locations. Electrameccanica Vehicles Corp. was incorporated in 2015 and is headquartered in Burnaby, Canada.
| Metric | 2022 | 2021 | 2020 | 2019 | 2018 | 2017 | 2016 | 2015 | 2014 |
|---|---|---|---|---|---|---|---|---|---|
| Revenue | 608.43K | 6.81M | 2.10M | 568.52K | 446.07K | 451.68K | 68.26K | 0.00 | 0.00 |
| Cost of Revenue | 1.55M | 33.07M | 4.33M | 699.46K | 371.68K | 334.23K | 39.98K | 0.00 | 0.00 |
| Gross Profit | -941.19K | -26.26M | -2.23M | -130.93K | 74.39K | 117.46K | 28.28K | 0.00 | 0.00 |
| Gross Profit Ratio | -154.69% | -385.40% | -106.34% | -23.03% | 16.68% | 26.00% | 41.42% | 0.00% | 0.00% |
| Research & Development | 9.15M | 22.03M | 17.09M | 7.85M | 5.47M | 3.23M | 2.77M | 1.53M | 253.21K |
| General & Administrative | 32.45M | 39.76M | 26.81M | 15.09M | 8.69M | 5.71M | 2.72M | 3.26M | 253.25K |
| Selling & Marketing | 2.96M | 14.66M | 10.41M | 2.53M | 1.00M | 805.91K | 394.76K | 115.27K | 10.24K |
| SG&A | 35.41M | 54.42M | 37.22M | 17.62M | 9.70M | 6.52M | 3.11M | 3.38M | 263.49K |
| Other Expenses | -2.13M | -15.74M | 4.09M | 1.53M | 613.43K | 161.90K | 77.61K | 12.42K | 327.17 |
| Operating Expenses | 44.57M | 76.45M | 58.40M | 27.00M | 15.78M | 9.91M | 5.96M | 4.92M | 517.03K |
| Cost & Expenses | 46.12M | 109.52M | 62.73M | 27.70M | 16.15M | 10.25M | 6.00M | 4.92M | 517.03K |
| Interest Income | 4.91M | 2.30M | 270.42K | 169.71K | 57.20K | 0.00 | 0.00 | 0.00 | 0.00 |
| Interest Expense | 0.00 | 28.49M | 0.00 | 0.00 | 0.00 | 0.00 | 43.49K | 14.26K | 47.85 |
| Depreciation & Amortization | 3.45M | 20.94M | -14.61M | 1.60M | 722.06K | 161.90K | 77.61K | 12.42K | 327.17 |
| EBITDA | -27.21M | -89.36M | -75.41M | 10.84M | -14.98M | -9.63M | -6.02M | -4.91M | -516.70K |
| EBITDA Ratio | -4,472.79% | -1,311.67% | -3,589.47% | 1,907.10% | -3,358.85% | -2,132.99% | -8,815.02% | 0.00% | 0.00% |
| Operating Income | -55.00M | -110.30M | -60.80M | 9.24M | -15.70M | -9.80M | -5.93M | -6.61M | -517.03K |
| Operating Income Ratio | -9,039.77% | -1,619.07% | -2,893.97% | 1,625.03% | -3,520.72% | -2,168.84% | -8,691.90% | 0.00% | 0.00% |
| Total Other Income/Expenses | -12.07M | -13.38M | 16.96M | -35.87M | -3.30M | 3.85M | -1.17M | -2.98K | -946.14 |
| Income Before Tax | -57.58M | -123.67M | -41.33M | -63.08M | -17.74M | -5.83M | -7.11M | -4.94M | -517.98K |
| Income Before Tax Ratio | -9,463.91% | -1,815.43% | -1,967.18% | -11,095.36% | -3,976.07% | -1,291.62% | -10,411.40% | 0.00% | 0.00% |
| Income Tax Expense | 1.00K | 23.55K | 850.00 | -32.55K | -60.26K | -968.67 | 43.49K | 14.26K | 47.85 |
| Net Income | -57.58M | -123.70M | -41.33M | -63.05M | -17.68M | -5.83M | -7.11M | -4.94M | -517.98K |
| Net Income Ratio | -9,464.08% | -1,815.77% | -1,967.22% | -11,089.64% | -3,962.56% | -1,291.41% | -10,411.40% | 0.00% | 0.00% |
| EPS | -0.48 | -1.04 | -0.37 | -1.08 | -0.49 | -0.22 | -0.32 | -0.23 | -0.02 |
| EPS Diluted | -0.48 | -1.04 | -0.37 | -1.08 | -0.49 | -0.22 | -0.32 | -0.23 | -0.02 |
| Weighted Avg Shares Out | 119.29M | 118.74M | 111.72M | 58.35M | 36.00M | 26.58M | 21.82M | 21.36M | 21.36M |
| Weighted Avg Shares Out (Dil) | 119.29M | 118.74M | 111.72M | 58.35M | 36.00M | 26.58M | 21.82M | 21.36M | 21.36M |

3 Meme Stocks That Won't Rebound, No Matter What Social Media Says

The 3 Most Undervalued Micro-Cap Stocks to Buy Now: August 2023

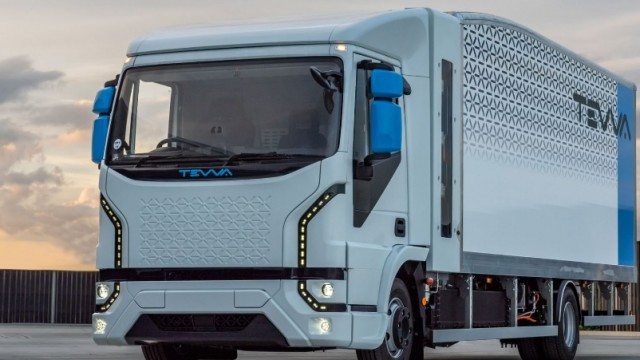
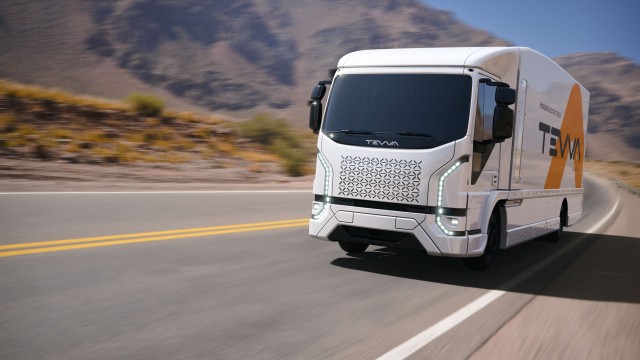
ElectraMeccanica (SOLO), Tevva to Merge in Green Vehicle Leap

3 Sorry EV Stocks to Sell in August Before It's Too Late

Royal Mail electric truck supplier Tevva will transfer main base to USA as part of ElectraMeccanica deal

SOLO Stock Alert: Electrameccanica Surges on Merger Plans

ElectraMeccanica to merge with electric truck startup Tevva

SOLO Stock Alert: Halper Sadeh LLC Is Investigating Whether the Merger of ElectraMeccanica Vehicles Corp. Is Fair to Shareholders

UK electric truck maker Tevva reverses into US EV manufacturer ElectraMeccanica

EV trucker maker Tevva buying Electrameccanica Vehicles as part of U.S. push
Source: https://incomestatements.info
Category: Stock Reports
