See more : British Smaller Companies VCT 2 plc (BSC.L) Income Statement Analysis – Financial Results
Complete financial analysis of Electrameccanica Vehicles Corp. (SOLO) income statement, including revenue, profit margins, EPS and key performance metrics. Get detailed insights into the financial performance of Electrameccanica Vehicles Corp., a leading company in the Auto – Manufacturers industry within the Consumer Cyclical sector.
- Roma Group Limited (8072.HK) Income Statement Analysis – Financial Results
- Mountain High Acquisitions Corp. (MYHI) Income Statement Analysis – Financial Results
- Kontrol Technologies Corp. (KNR.NE) Income Statement Analysis – Financial Results
- Petro Rio S.A. (PTRRY) Income Statement Analysis – Financial Results
- India Glycols Limited (INDIAGLYCO.NS) Income Statement Analysis – Financial Results
Electrameccanica Vehicles Corp. (SOLO)
About Electrameccanica Vehicles Corp.
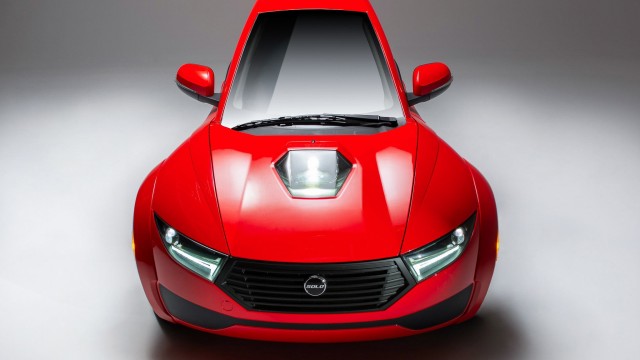
Electrameccanica Vehicles Corp., a development-stage company, develops, manufactures, and sells electric vehicles in Canada. The company operates in two segments, Electric Vehicles and Custom Build Vehicles. Its flagship product is the SOLO, a single seat vehicle. The company is also developing Tofino, an all-electric two-seater roadster. It also develops and manufactures custom built vehicles. The company sells its vehicles online through electrameccanica.com, as well as through 17 retail locations. Electrameccanica Vehicles Corp. was incorporated in 2015 and is headquartered in Burnaby, Canada.
| Metric | 2022 | 2021 | 2020 | 2019 | 2018 | 2017 | 2016 | 2015 | 2014 |
|---|---|---|---|---|---|---|---|---|---|
| Revenue | 608.43K | 6.81M | 2.10M | 568.52K | 446.07K | 451.68K | 68.26K | 0.00 | 0.00 |
| Cost of Revenue | 1.55M | 33.07M | 4.33M | 699.46K | 371.68K | 334.23K | 39.98K | 0.00 | 0.00 |
| Gross Profit | -941.19K | -26.26M | -2.23M | -130.93K | 74.39K | 117.46K | 28.28K | 0.00 | 0.00 |
| Gross Profit Ratio | -154.69% | -385.40% | -106.34% | -23.03% | 16.68% | 26.00% | 41.42% | 0.00% | 0.00% |
| Research & Development | 9.15M | 22.03M | 17.09M | 7.85M | 5.47M | 3.23M | 2.77M | 1.53M | 253.21K |
| General & Administrative | 32.45M | 39.76M | 26.81M | 15.09M | 8.69M | 5.71M | 2.72M | 3.26M | 253.25K |
| Selling & Marketing | 2.96M | 14.66M | 10.41M | 2.53M | 1.00M | 805.91K | 394.76K | 115.27K | 10.24K |
| SG&A | 35.41M | 54.42M | 37.22M | 17.62M | 9.70M | 6.52M | 3.11M | 3.38M | 263.49K |
| Other Expenses | -2.13M | -15.74M | 4.09M | 1.53M | 613.43K | 161.90K | 77.61K | 12.42K | 327.17 |
| Operating Expenses | 44.57M | 76.45M | 58.40M | 27.00M | 15.78M | 9.91M | 5.96M | 4.92M | 517.03K |
| Cost & Expenses | 46.12M | 109.52M | 62.73M | 27.70M | 16.15M | 10.25M | 6.00M | 4.92M | 517.03K |
| Interest Income | 4.91M | 2.30M | 270.42K | 169.71K | 57.20K | 0.00 | 0.00 | 0.00 | 0.00 |
| Interest Expense | 0.00 | 28.49M | 0.00 | 0.00 | 0.00 | 0.00 | 43.49K | 14.26K | 47.85 |
| Depreciation & Amortization | 3.45M | 20.94M | -14.61M | 1.60M | 722.06K | 161.90K | 77.61K | 12.42K | 327.17 |
| EBITDA | -27.21M | -89.36M | -75.41M | 10.84M | -14.98M | -9.63M | -6.02M | -4.91M | -516.70K |
| EBITDA Ratio | -4,472.79% | -1,311.67% | -3,589.47% | 1,907.10% | -3,358.85% | -2,132.99% | -8,815.02% | 0.00% | 0.00% |
| Operating Income | -55.00M | -110.30M | -60.80M | 9.24M | -15.70M | -9.80M | -5.93M | -6.61M | -517.03K |
| Operating Income Ratio | -9,039.77% | -1,619.07% | -2,893.97% | 1,625.03% | -3,520.72% | -2,168.84% | -8,691.90% | 0.00% | 0.00% |
| Total Other Income/Expenses | -12.07M | -13.38M | 16.96M | -35.87M | -3.30M | 3.85M | -1.17M | -2.98K | -946.14 |
| Income Before Tax | -57.58M | -123.67M | -41.33M | -63.08M | -17.74M | -5.83M | -7.11M | -4.94M | -517.98K |
| Income Before Tax Ratio | -9,463.91% | -1,815.43% | -1,967.18% | -11,095.36% | -3,976.07% | -1,291.62% | -10,411.40% | 0.00% | 0.00% |
| Income Tax Expense | 1.00K | 23.55K | 850.00 | -32.55K | -60.26K | -968.67 | 43.49K | 14.26K | 47.85 |
| Net Income | -57.58M | -123.70M | -41.33M | -63.05M | -17.68M | -5.83M | -7.11M | -4.94M | -517.98K |
| Net Income Ratio | -9,464.08% | -1,815.77% | -1,967.22% | -11,089.64% | -3,962.56% | -1,291.41% | -10,411.40% | 0.00% | 0.00% |
| EPS | -0.48 | -1.04 | -0.37 | -1.08 | -0.49 | -0.22 | -0.32 | -0.23 | -0.02 |
| EPS Diluted | -0.48 | -1.04 | -0.37 | -1.08 | -0.49 | -0.22 | -0.32 | -0.23 | -0.02 |
| Weighted Avg Shares Out | 119.29M | 118.74M | 111.72M | 58.35M | 36.00M | 26.58M | 21.82M | 21.36M | 21.36M |
| Weighted Avg Shares Out (Dil) | 119.29M | 118.74M | 111.72M | 58.35M | 36.00M | 26.58M | 21.82M | 21.36M | 21.36M |

3 Speculative Penny Stocks That Are Worth a Look

The 3 Worst EV Stocks You Can Buy Right Now

Electrameccanica Vehicles: Worth Keeping On One's Radar

Billionaire Israel Englander Is Betting on These 3 EV Stocks

ElectraMeccanica Vehicles Corp. (SOLO) Reports Q2 Loss, Misses Revenue Estimates

7 Penny Stocks Trading at a Massive Discount Right Now

Why ElectraMeccanica Vehicles Dropped 11% Today

7 Penny Stocks That Could Triple in 2022

ElectraMeccanica: Does The Company Have A Role To Play In The Future Of Transportation?

ElectraMeccanica Vehicles says 1Q revenue jumped over 400%
Source: https://incomestatements.info
Category: Stock Reports
