See more : Stern Groep N.V. (STRN.AS) Income Statement Analysis – Financial Results
Complete financial analysis of Sayona Mining Limited (SYAXF) income statement, including revenue, profit margins, EPS and key performance metrics. Get detailed insights into the financial performance of Sayona Mining Limited, a leading company in the Industrial Materials industry within the Basic Materials sector.
- Allcargo Logistics Limited (ALLCARGO.BO) Income Statement Analysis – Financial Results
- Compagnie d’Entreprises CFE SA (CFEB.BR) Income Statement Analysis – Financial Results
- China Aviation Oil (Singapore) Corporation Ltd (CAOLF) Income Statement Analysis – Financial Results
- Atlas Arteria Limited (ALX.AX) Income Statement Analysis – Financial Results
- Life Settlement Assets PLC (LSAA.L) Income Statement Analysis – Financial Results
Sayona Mining Limited (SYAXF)
About Sayona Mining Limited
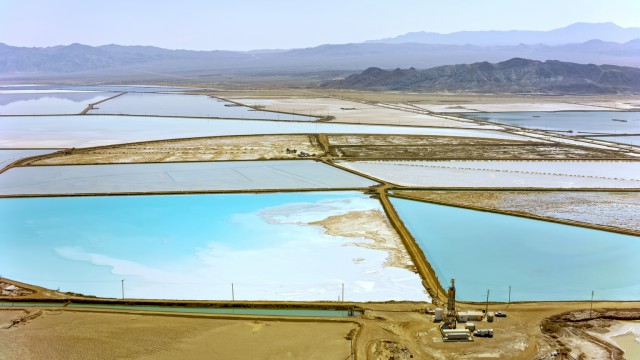
Sayona Mining Limited, together with its subsidiaries, engages in mineral identification, acquisition, exploration, and development in Australia and Canada. It explores for lithium, graphite, and gold deposits. It holds 100% interest in the Authier Lithium project located in Quebec, Canada; and 60% interest in the Moblan lithium project located in Northern Québec. The company was formerly known as DiamonEx Limited and changed its name to Sayona Mining Limited in May 2013. Sayona Mining Limited was incorporated in 2000 and is based in Paddington, Australia.
| Metric | 2024 | 2023 | 2022 | 2021 | 2020 | 2019 | 2018 | 2017 | 2016 | 2015 | 2014 | 2013 | 2012 | 2011 | 2010 | 2009 | 2008 | 2007 | 2006 | 2005 | 2004 |
|---|---|---|---|---|---|---|---|---|---|---|---|---|---|---|---|---|---|---|---|---|---|
| Revenue | 200.87M | 1.70M | 387.00K | 645.39K | 60.43K | 124.10K | 79.29K | 14.54K | 42.76K | 55.22K | 39.43K | 15.92K | 0.00 | 0.00 | 0.00 | 0.00 | 0.00 | 0.00 | 0.00 | 0.00 | 43.55K |
| Cost of Revenue | 22.58M | 6.16M | 50.00K | 51.76K | 53.57K | 9.37K | 6.64K | 7.07K | 1.84K | 0.00 | 0.00 | 0.00 | 0.00 | 0.00 | 0.00 | 0.00 | 0.00 | 0.00 | 0.00 | 0.00 | 0.00 |
| Gross Profit | 178.29M | -4.47M | 337.00K | 593.63K | 6.86K | 114.73K | 72.65K | 7.47K | 40.93K | 55.22K | 39.43K | 15.92K | 0.00 | 0.00 | 0.00 | 0.00 | 0.00 | 0.00 | 0.00 | 0.00 | 43.55K |
| Gross Profit Ratio | 88.76% | -263.54% | 87.08% | 91.98% | 11.35% | 92.45% | 91.62% | 51.37% | 95.70% | 100.00% | 100.00% | 100.00% | 0.00% | 0.00% | 0.00% | 0.00% | 0.00% | 0.00% | 0.00% | 0.00% | 100.00% |
| Research & Development | 0.00 | 0.00 | 0.00 | 0.00 | 0.00 | 0.00 | 0.00 | 0.00 | 0.00 | 0.00 | 0.00 | 0.00 | 0.00 | 0.00 | 0.00 | 0.00 | 0.00 | 0.00 | 0.00 | 0.00 | 0.00 |
| General & Administrative | 6.80M | 26.97M | 20.75M | 4.94M | 3.73M | 2.27M | 2.16M | 1.75M | 1.24M | 269.69K | 344.56K | 231.15K | 382.62K | 322.49K | 747.84K | 2.09M | 2.12M | 1.58M | 1.08M | 939.00K | 552.85K |
| Selling & Marketing | 267.41M | -7.34M | 0.00 | 0.00 | 0.00 | 0.00 | 0.00 | 0.00 | 0.00 | 0.00 | 0.00 | 0.00 | 0.00 | 0.00 | 0.00 | 0.00 | 0.00 | 0.00 | 0.00 | 0.00 | 0.00 |
| SG&A | 274.21M | 19.63M | 20.75M | 4.94M | 3.73M | 2.27M | 2.16M | 1.75M | 1.24M | 269.69K | 344.56K | 231.15K | 382.62K | 322.49K | 747.84K | 2.09M | 2.12M | 1.58M | 1.08M | 939.00K | 552.85K |
| Other Expenses | 23.55M | 15.21M | 105.30M | 643.14K | 3.65K | 4.51K | -2.00K | -113.02K | -22.83K | -7.57K | -43.18K | -360.06K | -18.23K | 2.33M | 300.39K | 392.23K | 2.41K | 0.00 | 0.00 | 2.68K | 0.00 |
| Operating Expenses | 297.76M | 19.63M | 20.80M | 4.31M | 4.69M | 2.35M | 2.40M | 2.48M | 2.52M | 582.58K | 472.32K | 238.14K | 504.77K | 322.49K | 775.57K | 4.65M | 3.76M | 2.31M | 1.20M | 1.45M | 559.43K |
| Cost & Expenses | 319.94M | 25.79M | 20.80M | 4.31M | 4.69M | 2.35M | 2.40M | 2.48M | 2.52M | 582.58K | 472.32K | 238.14K | 504.77K | 322.49K | 775.57K | 4.65M | 3.76M | 2.31M | 1.20M | 1.45M | 559.43K |
| Interest Income | 7.67M | 2.82M | 110.64K | 2.25K | 10.43K | 114.24K | 66.79K | 14.54K | 26.36K | 21.12K | 39.43K | 7.60K | 0.00 | 1.64K | 2.65K | 33.42K | 312.90K | 123.17K | 46.60K | 79.45K | 0.00 |
| Interest Expense | 4.05M | 1.51M | 926.64K | 769.97K | 785.27K | 0.00 | 0.00 | 0.00 | 0.00 | 0.00 | 0.00 | 23.52K | 0.00 | 829.44K | 1.84M | 3.26M | 1.08M | 7.00 | 0.00 | 0.00 | 0.00 |
| Depreciation & Amortization | 33.78M | 6.16M | 50.00K | 51.76K | 53.57K | 9.37K | 6.64K | 7.07K | 1.84K | 2.50K | 1.14K | 164.06K | 0.00 | 0.00 | 27.74K | 40.85K | 259.11K | 111.06K | 118.41K | 107.31K | 6.58K |
| EBITDA | -78.35M | -19.03M | -20.57M | -4.28M | -3.80M | -2.21M | -2.31M | -2.45M | -2.47M | -522.36K | -430.62K | -466.32K | -504.77K | 2.01M | -417.06K | -4.14M | -2.92M | -1.96M | -1.08M | -1.34M | -509.30K |
| EBITDA Ratio | -39.00% | -1,158.23% | 21,876.71% | -551.26% | -7,554.18% | -1,889.15% | -3,018.43% | -17,002.97% | -5,880.99% | -1,050.51% | -2,689.18% | -3,609.74% | 0.00% | 0.00% | 0.00% | 0.00% | 0.00% | 0.00% | 0.00% | 0.00% | -1,169.52% |
| Operating Income | -119.07M | -25.79M | 84.61M | -3.61M | -4.62M | -2.35M | -2.40M | -2.48M | -2.52M | -582.58K | -1.06M | -574.67K | -504.77K | 2.01M | -444.79K | -4.18M | -3.18M | -2.08M | -1.20M | -1.45M | -515.88K |
| Operating Income Ratio | -59.28% | -1,521.77% | 21,863.78% | -559.28% | -7,642.83% | -1,896.70% | -3,026.81% | -17,051.60% | -5,885.29% | -1,055.03% | -2,692.08% | -3,609.74% | 0.00% | 0.00% | 0.00% | 0.00% | 0.00% | 0.00% | 0.00% | 0.00% | -1,184.63% |
| Total Other Income/Expenses | 3.62M | 14.82M | 3.73M | -137.13K | -1.59M | -5.35K | -14.50K | -113.02K | -38.67K | -41.67K | 545.90K | -408.16K | -18.23K | -4.03M | -1.42M | -3.22M | -1.08M | -7.00 | 165.01K | 189.44K | 6.58K |
| Income Before Tax | -115.45M | -9.28M | 83.69M | -4.38M | -5.40M | -2.23M | -2.33M | -2.57M | -2.51M | -566.53K | 114.15K | -630.38K | -523.00K | -2.02M | -1.87M | -7.41M | -4.26M | -2.08M | -1.03M | -1.26M | -509.30K |
| Income Before Tax Ratio | -57.47% | -547.37% | 21,624.33% | -678.58% | -8,942.31% | -1,793.46% | -2,936.72% | -17,680.29% | -5,872.73% | -1,025.97% | 289.52% | -3,959.65% | 0.00% | 0.00% | 0.00% | 0.00% | 0.00% | 0.00% | 0.00% | 0.00% | -1,169.52% |
| Income Tax Expense | 3.58M | 3.65M | 131.02M | 1.41M | 788.92K | -123.61K | -73.43K | -21.61K | -28.20K | -23.62K | -629.65K | -500.60K | 0.00 | 0.00 | 2.14M | 1.69K | 118.78K | 54.55K | 0.00 | -1.26M | -509.30K |
| Net Income | -101.40M | -13.63M | 58.89M | -4.38M | -5.40M | -2.23M | -2.33M | -2.57M | -2.51M | -566.53K | 114.15K | -630.38K | -523.00K | -2.02M | -1.87M | -29.86M | -4.38M | -2.13M | -1.03M | -1.26M | -509.30K |
| Net Income Ratio | -50.48% | -803.89% | 15,218.32% | -678.58% | -8,942.31% | -1,793.46% | -2,936.72% | -17,680.29% | -5,872.73% | -1,025.97% | 289.52% | -3,959.65% | 0.00% | 0.00% | 0.00% | 0.00% | 0.00% | 0.00% | 0.00% | 0.00% | -1,169.52% |
| EPS | -0.01 | 0.00 | 0.01 | 0.00 | 0.00 | 0.00 | 0.00 | 0.00 | 0.00 | 0.00 | 0.00 | 0.00 | 0.00 | -0.03 | -0.03 | -0.56 | -0.11 | -0.08 | -0.06 | -0.08 | -0.05 |
| EPS Diluted | -0.01 | 0.00 | 0.01 | 0.00 | 0.00 | 0.00 | 0.00 | 0.00 | 0.00 | 0.00 | 0.00 | 0.00 | 0.00 | -0.03 | -0.03 | -0.56 | -0.11 | -0.08 | -0.06 | -0.08 | -0.05 |
| Weighted Avg Shares Out | 10.28B | 8.70B | 6.79B | 3.44B | 2.12B | 1.81B | 1.41B | 922.66M | 589.18M | 512.95M | 493.14M | 217.50M | 204.37M | 65.65M | 56.39M | 53.14M | 40.20M | 25.84M | 17.48M | 14.85M | 9.31M |
| Weighted Avg Shares Out (Dil) | 10.28B | 8.70B | 7.20B | 3.44B | 2.12B | 1.81B | 1.41B | 922.66M | 589.18M | 512.95M | 493.14M | 217.50M | 204.37M | 65.65M | 56.39M | 53.14M | 40.20M | 25.84M | 17.48M | 14.85M | 9.31M |

Australia's Sayona Mining buys US based Piedmont Lithium

Lithium Miners News For The Month Of October 2024

Quarterly Activities Report June 2024

Lucas Dow appointed as Managing Director and Chief Executive Officer

Further high-grade drilling results at North American Lithium

Moblan drilling reveals further high-grade lithium intersections

Moblan drilling delivers thick, high grade intersections

New high-grade zones discovered at North American Lithium

Top 10 Lithium Companies To Consider

Lithium Miners News For The Month Of February 2024
Source: https://incomestatements.info
Category: Stock Reports
