Complete financial analysis of Del Taco Restaurants, Inc. (TACO) income statement, including revenue, profit margins, EPS and key performance metrics. Get detailed insights into the financial performance of Del Taco Restaurants, Inc., a leading company in the Restaurants industry within the Consumer Cyclical sector.
- Richtech Robotics Inc. Class B Common Stock (RR) Income Statement Analysis – Financial Results
- Banco Inter S.A. (BIDI3.SA) Income Statement Analysis – Financial Results
- ZIOPHARM Oncology, Inc. (ZIOP) Income Statement Analysis – Financial Results
- Indo Count Industries Limited (ICIL.BO) Income Statement Analysis – Financial Results
- TAYA Co.,Ltd. (4679.T) Income Statement Analysis – Financial Results
Del Taco Restaurants, Inc. (TACO)
About Del Taco Restaurants, Inc.
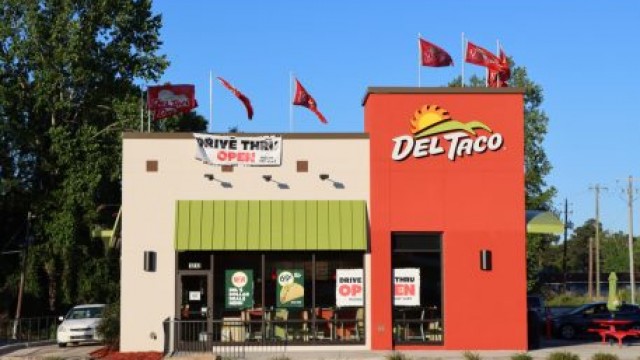
Del Taco Restaurants, Inc. develops, franchises, owns, and operates Del Taco quick-service Mexican-American restaurants in the United States. The company's restaurants offer Mexican inspired and American classic dishes. As of August 31, 2021, it operated approximately 600 restaurants across 16 states. The company was founded in 1964 and is headquartered in Lake Forest, California.
| Metric | 2021 | 2020 | 2019 | 2018 | 2017 | 2016 | 2015 | 2014 | 2013 |
|---|---|---|---|---|---|---|---|---|---|
| Revenue | 527.36M | 491.88M | 512.95M | 505.49M | 471.46M | 452.08M | 424.00M | 0.00 | 370.99M |
| Cost of Revenue | 0.00 | 382.78M | 396.65M | 381.74M | 365.84M | 346.96M | 116.71M | 1.40B | 293.56M |
| Gross Profit | 527.36M | 109.11M | 116.31M | 123.75M | 105.62M | 105.13M | 307.29M | -1.40B | 77.43M |
| Gross Profit Ratio | 100.00% | 22.18% | 22.67% | 24.48% | 22.40% | 23.25% | 72.47% | 0.00% | 20.87% |
| Research & Development | 0.00 | 0.00 | 0.00 | 0.00 | 0.00 | 0.00 | 0.00 | 0.00 | 0.00 |
| General & Administrative | 51.67M | 44.00M | 43.88M | 43.77M | 38.15M | 37.22M | 244.61M | 861.68K | 23.11M |
| Selling & Marketing | 0.00 | 15.12M | 14.52M | 13.30M | 0.00 | 0.00 | 0.00 | 0.00 | 0.00 |
| SG&A | 51.67M | 59.11M | 58.39M | 57.07M | 38.15M | 37.22M | 244.61M | 861.68K | 23.11M |
| Other Expenses | 463.64M | 27.07M | 27.14M | 660.00K | 24.95M | 0.00 | 21.96M | 716.22K | 20.45M |
| Operating Expenses | 515.31M | 86.18M | 85.53M | 84.45M | 63.11M | 61.08M | 266.57M | 1.58M | 43.56M |
| Cost & Expenses | 515.31M | 468.96M | 482.18M | 466.19M | 428.94M | 408.04M | 383.28M | 1.58M | 337.12M |
| Interest Income | 0.00 | 0.00 | 0.00 | 0.00 | 0.00 | 0.00 | 0.00 | 62.00K | 0.00 |
| Interest Expense | 2.89M | 4.81M | 7.24M | 9.08M | 7.20M | 6.33M | -15.14M | 62.00K | 35.61M |
| Depreciation & Amortization | -949.00K | 48.63M | 47.17M | 25.03M | 22.55M | 22.52M | 19.53M | -180.00K | 19.85M |
| EBITDA | 11.10M | 71.56M | 78.31M | 65.75M | 65.88M | 67.18M | 9.99M | -1.40B | 53.72M |
| EBITDA Ratio | 2.10% | 14.55% | 15.27% | 13.01% | 13.97% | 14.86% | 2.36% | 0.00% | 14.48% |
| Operating Income | 12.05M | 22.92M | 31.14M | 34.03M | 41.25M | 43.30M | -9.53M | -1.40M | 33.37M |
| Operating Income Ratio | 2.28% | 4.66% | 6.07% | 6.73% | 8.75% | 9.58% | -2.25% | 0.00% | 8.99% |
| Total Other Income/Expenses | -3.84M | -114.72M | -145.05M | -8.42M | -7.20M | -7.06M | 15.14M | 1.40B | -39.82M |
| Income Before Tax | 8.21M | -91.80M | -113.91M | 25.62M | 34.05M | 36.24M | 5.61M | -1.52M | -6.46M |
| Income Before Tax Ratio | 1.56% | -18.66% | -22.21% | 5.07% | 7.22% | 8.02% | 1.32% | 0.00% | -1.74% |
| Income Tax Expense | 2.49M | -2.06M | 4.37M | 6.66M | -15.82M | 15.33M | 852.00K | 8.97K | 80.00K |
| Net Income | 5.72M | -89.74M | -118.29M | 18.96M | 49.87M | 20.91M | 4.76M | -1.52M | -6.54M |
| Net Income Ratio | 1.08% | -18.24% | -23.06% | 3.75% | 10.58% | 4.63% | 1.12% | 0.00% | -1.76% |
| EPS | 0.16 | -2.41 | -3.20 | 0.50 | 1.29 | 0.54 | 0.87 | -0.32 | -0.35 |
| EPS Diluted | 0.16 | -2.41 | -3.20 | 0.49 | 1.25 | 0.53 | 0.85 | -0.32 | -0.35 |
| Weighted Avg Shares Out | 36.79M | 37.16M | 37.02M | 38.11M | 38.69M | 38.73M | 5.49M | 4.75M | 18.75M |
| Weighted Avg Shares Out (Dil) | 36.79M | 37.16M | 37.02M | 38.68M | 39.95M | 39.27M | 5.61M | 4.75M | 18.75M |

Restaurant Industry Consolidation Continues As Jack In The Box Buys Del Taco

Why Del Taco Rallied 66% Today, While Jack in the Box Fell a Little

Shareholder Alert: Ademi LLP investigates whether Del Taco Restaurants, Inc. has obtained a Fair Price in its transaction with Jack in the Box Inc.

Restaurant Stocks: What's Going on With TACO, DIN, CAKE, MCD, BJRI and FRGI Today?

Del Taco Merger Investigation: Halper Sadeh LLP Announces Investigation Into Whether the Sale of Del Taco Restaurants, Inc. Is Fair to Shareholders; Investors Are Encouraged to Contact the Firm – TACO

Del Taco Merger Investigation: Halper Sadeh LLP Announces Investigation Into Whether the Sale of Del Taco Restaurants, Inc. Is Fair to Shareholders; Investors Are Encouraged to Contact the Firm – TACO

ISIG Stock: 6 Things to Know About Insignia Systems as Shares Rocket Today

Jack in the Box Acquisition Shows Value, Power of Drive-Thrus

Jack In The Box Will Buy Del Taco In $575 Million Deal

Why Jack In The Box (JACK) Is Buying Del Taco (TACO) In $575 Million Deal
Source: https://incomestatements.info
Category: Stock Reports
