See more : Wadakohsan Corporation (8931.T) Income Statement Analysis – Financial Results
Complete financial analysis of Del Taco Restaurants, Inc. (TACO) income statement, including revenue, profit margins, EPS and key performance metrics. Get detailed insights into the financial performance of Del Taco Restaurants, Inc., a leading company in the Restaurants industry within the Consumer Cyclical sector.
- Knight-Swift Transportation Holdings Inc. (KNX) Income Statement Analysis – Financial Results
- Omaxe Limited (OMAXE.BO) Income Statement Analysis – Financial Results
- Jiangsu Huaxin New Material Co.,Ltd. (300717.SZ) Income Statement Analysis – Financial Results
- Rorze Corporation (6323.T) Income Statement Analysis – Financial Results
- Adams Plc (ADA.L) Income Statement Analysis – Financial Results
Del Taco Restaurants, Inc. (TACO)
About Del Taco Restaurants, Inc.
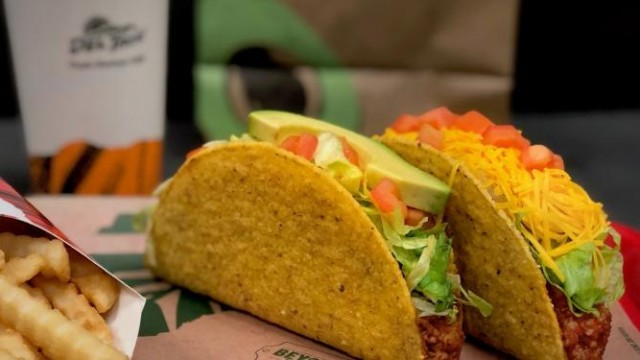
Del Taco Restaurants, Inc. develops, franchises, owns, and operates Del Taco quick-service Mexican-American restaurants in the United States. The company's restaurants offer Mexican inspired and American classic dishes. As of August 31, 2021, it operated approximately 600 restaurants across 16 states. The company was founded in 1964 and is headquartered in Lake Forest, California.
| Metric | 2021 | 2020 | 2019 | 2018 | 2017 | 2016 | 2015 | 2014 | 2013 |
|---|---|---|---|---|---|---|---|---|---|
| Revenue | 527.36M | 491.88M | 512.95M | 505.49M | 471.46M | 452.08M | 424.00M | 0.00 | 370.99M |
| Cost of Revenue | 0.00 | 382.78M | 396.65M | 381.74M | 365.84M | 346.96M | 116.71M | 1.40B | 293.56M |
| Gross Profit | 527.36M | 109.11M | 116.31M | 123.75M | 105.62M | 105.13M | 307.29M | -1.40B | 77.43M |
| Gross Profit Ratio | 100.00% | 22.18% | 22.67% | 24.48% | 22.40% | 23.25% | 72.47% | 0.00% | 20.87% |
| Research & Development | 0.00 | 0.00 | 0.00 | 0.00 | 0.00 | 0.00 | 0.00 | 0.00 | 0.00 |
| General & Administrative | 51.67M | 44.00M | 43.88M | 43.77M | 38.15M | 37.22M | 244.61M | 861.68K | 23.11M |
| Selling & Marketing | 0.00 | 15.12M | 14.52M | 13.30M | 0.00 | 0.00 | 0.00 | 0.00 | 0.00 |
| SG&A | 51.67M | 59.11M | 58.39M | 57.07M | 38.15M | 37.22M | 244.61M | 861.68K | 23.11M |
| Other Expenses | 463.64M | 27.07M | 27.14M | 660.00K | 24.95M | 0.00 | 21.96M | 716.22K | 20.45M |
| Operating Expenses | 515.31M | 86.18M | 85.53M | 84.45M | 63.11M | 61.08M | 266.57M | 1.58M | 43.56M |
| Cost & Expenses | 515.31M | 468.96M | 482.18M | 466.19M | 428.94M | 408.04M | 383.28M | 1.58M | 337.12M |
| Interest Income | 0.00 | 0.00 | 0.00 | 0.00 | 0.00 | 0.00 | 0.00 | 62.00K | 0.00 |
| Interest Expense | 2.89M | 4.81M | 7.24M | 9.08M | 7.20M | 6.33M | -15.14M | 62.00K | 35.61M |
| Depreciation & Amortization | -949.00K | 48.63M | 47.17M | 25.03M | 22.55M | 22.52M | 19.53M | -180.00K | 19.85M |
| EBITDA | 11.10M | 71.56M | 78.31M | 65.75M | 65.88M | 67.18M | 9.99M | -1.40B | 53.72M |
| EBITDA Ratio | 2.10% | 14.55% | 15.27% | 13.01% | 13.97% | 14.86% | 2.36% | 0.00% | 14.48% |
| Operating Income | 12.05M | 22.92M | 31.14M | 34.03M | 41.25M | 43.30M | -9.53M | -1.40M | 33.37M |
| Operating Income Ratio | 2.28% | 4.66% | 6.07% | 6.73% | 8.75% | 9.58% | -2.25% | 0.00% | 8.99% |
| Total Other Income/Expenses | -3.84M | -114.72M | -145.05M | -8.42M | -7.20M | -7.06M | 15.14M | 1.40B | -39.82M |
| Income Before Tax | 8.21M | -91.80M | -113.91M | 25.62M | 34.05M | 36.24M | 5.61M | -1.52M | -6.46M |
| Income Before Tax Ratio | 1.56% | -18.66% | -22.21% | 5.07% | 7.22% | 8.02% | 1.32% | 0.00% | -1.74% |
| Income Tax Expense | 2.49M | -2.06M | 4.37M | 6.66M | -15.82M | 15.33M | 852.00K | 8.97K | 80.00K |
| Net Income | 5.72M | -89.74M | -118.29M | 18.96M | 49.87M | 20.91M | 4.76M | -1.52M | -6.54M |
| Net Income Ratio | 1.08% | -18.24% | -23.06% | 3.75% | 10.58% | 4.63% | 1.12% | 0.00% | -1.76% |
| EPS | 0.16 | -2.41 | -3.20 | 0.50 | 1.29 | 0.54 | 0.87 | -0.32 | -0.35 |
| EPS Diluted | 0.16 | -2.41 | -3.20 | 0.49 | 1.25 | 0.53 | 0.85 | -0.32 | -0.35 |
| Weighted Avg Shares Out | 36.79M | 37.16M | 37.02M | 38.11M | 38.69M | 38.73M | 5.49M | 4.75M | 18.75M |
| Weighted Avg Shares Out (Dil) | 36.79M | 37.16M | 37.02M | 38.68M | 39.95M | 39.27M | 5.61M | 4.75M | 18.75M |

Jack In The Box To Buy Del Taco Restaurants For $575M, At 66% Premium

Jack in the Box buys Del Taco in $575 million deal

Jack in the Box buying Del Taco

Jack in the Box to Acquire Del Taco, Combining Two Challenger Brands to Create Substantial Opportunities for Growth and Increased Profitability

Jack in the Box to Acquire Del Taco, Combining Two Challenger Brands to Create Substantial Opportunities for Growth and Increased Profitability

4 Hot Restaurant Stocks to Buy Amid Industry Challenges

Sparkfly Powers Del Taco Restaurants’ Del Yeah! Rewards Program With Unmatched Middleware Technology

Sparkfly Powers Del Taco Restaurants' Del Yeah! Rewards Program With Unmatched Middleware Technology

Del Taco and Door Dash Launch “The Stuffed Quesadilla Tacos Tour” Live on Twitch with Popular Streamers

Del Taco Restaurants: Q3 Earnings Insights
Source: https://incomestatements.info
Category: Stock Reports
