See more : Aquila SA (ALAQU.PA) Income Statement Analysis – Financial Results
Complete financial analysis of Tokyo Electron Limited (TOELY) income statement, including revenue, profit margins, EPS and key performance metrics. Get detailed insights into the financial performance of Tokyo Electron Limited, a leading company in the Semiconductors industry within the Technology sector.
- Yoma Strategic Holdings Ltd. (Z59.SI) Income Statement Analysis – Financial Results
- Glanbia plc (GLAPY) Income Statement Analysis – Financial Results
- Dollar General Corporation (DG) Income Statement Analysis – Financial Results
- Byggmästare Anders J Ahlström Holding AB (publ) (AJA-B.ST) Income Statement Analysis – Financial Results
- Netbay Public Company Limited (NETBAY.BK) Income Statement Analysis – Financial Results
Tokyo Electron Limited (TOELY)
About Tokyo Electron Limited
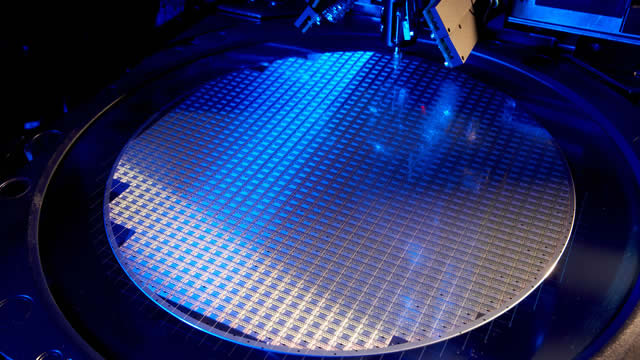
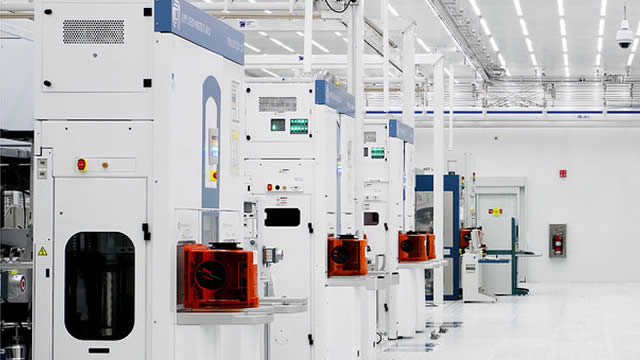
Tokyo Electron Limited, together with its subsidiaries, develops, manufactures, and sells semiconductor and flat panel display (FPD) production equipment in Japan, Europe, North America, Taiwan, China, South Korea, and internationally. The company's Semiconductor Production Equipment segment offers coaters/developers, etch systems, deposition systems, and cleaning systems used in wafer processing; wafer probers used in wafer testing process; and wafer bonders/debonders. Its Flat Panel Display Production Equipment segment provides coaters/developers and etch/ash systems for use in the manufacture of FPDs, as well as inkjet printing systems for manufacturing OLED panels. The company also offers logistic, facility maintenance, and insurance services. Tokyo Electron Limited was incorporated in 1951 and is headquartered in Tokyo, Japan.
| Metric | 2024 | 2023 | 2022 | 2021 | 2020 | 2019 | 2018 | 2017 | 2016 | 2015 | 2014 | 2013 |
|---|---|---|---|---|---|---|---|---|---|---|---|---|
| Revenue | 1,830.53B | 2,209.03B | 2,003.81B | 1,399.10B | 1,127.29B | 1,278.24B | 1,130.73B | 799.72B | 663.95B | 613.12B | 612.17B | 497.30B |
| Cost of Revenue | 1,000.26B | 1,224.62B | 1,091.98B | 834.16B | 675.34B | 752.06B | 655.70B | 477.43B | 396.74B | 370.35B | 410.28B | 338.55B |
| Gross Profit | 830.27B | 984.41B | 911.82B | 564.95B | 451.94B | 526.18B | 475.03B | 322.29B | 267.21B | 242.77B | 201.89B | 158.75B |
| Gross Profit Ratio | 45.36% | 44.56% | 45.50% | 40.38% | 40.09% | 41.16% | 42.01% | 40.30% | 40.25% | 39.60% | 32.98% | 31.92% |
| Research & Development | 202.87B | 191.20B | 158.26B | 136.65B | 120.27B | 113.98B | 97.10B | 83.80B | 76.29B | 71.35B | 78.66B | 73.25B |
| General & Administrative | 0.00 | 0.00 | 0.00 | 0.00 | 0.00 | 0.00 | 0.00 | 0.00 | 0.00 | 0.00 | 0.00 | 0.00 |
| Selling & Marketing | 0.00 | 0.00 | 0.00 | 0.00 | 0.00 | 0.00 | 0.00 | 0.00 | 0.00 | 0.00 | 0.00 | 0.00 |
| SG&A | 171.13B | 175.49B | 154.30B | 107.61B | 94.38B | 101.63B | 96.76B | 82.79B | 74.14B | 83.31B | 91.02B | 72.96B |
| Other Expenses | 1.00M | 3.46B | 1.60B | 2.16B | 3.55B | 0.00 | 0.00 | 0.00 | 0.00 | 0.00 | 0.00 | 0.00 |
| Operating Expenses | 374.01B | 366.68B | 312.55B | 244.26B | 214.65B | 215.61B | 193.86B | 166.59B | 150.42B | 156.85B | 216.81B | 142.65B |
| Cost & Expenses | 1,374.26B | 1,591.30B | 1,404.53B | 1,078.42B | 889.99B | 967.67B | 849.56B | 644.02B | 547.16B | 527.20B | 627.09B | 481.19B |
| Interest Income | 2.57B | 1.24B | 616.00M | 521.00M | 1.12B | 1.79B | 858.00M | 722.00M | 547.00M | 901.00M | 3.16B | 1.66B |
| Interest Expense | 0.00 | 0.00 | 0.00 | 0.00 | 0.00 | 0.00 | 0.00 | 0.00 | 0.00 | 0.00 | 0.00 | 266.00M |
| Depreciation & Amortization | 52.41B | 43.10B | 36.93B | 34.04B | 29.30B | 24.68B | 21.22B | 18.50B | 20.23B | 22.03B | 29.15B | 27.77B |
| EBITDA | 508.68B | 660.82B | 636.20B | 354.73B | 266.60B | 335.25B | 302.39B | 174.20B | 137.02B | 110.14B | 61.36B | 40.32B |
| EBITDA Ratio | 27.79% | 29.91% | 31.75% | 25.35% | 23.65% | 26.23% | 26.74% | 21.78% | 20.64% | 17.96% | 10.02% | 8.11% |
| Operating Income | 456.26B | 617.72B | 599.27B | 320.69B | 237.29B | 310.57B | 281.17B | 155.70B | 116.79B | 88.11B | 32.21B | 12.55B |
| Operating Income Ratio | 24.93% | 27.96% | 29.91% | 22.92% | 21.05% | 24.30% | 24.87% | 19.47% | 17.59% | 14.37% | 5.26% | 2.52% |
| Total Other Income/Expenses | 17.18B | 7.13B | -2.57B | -3.65B | 7.33B | 10.94B | -5.93B | -6.58B | -10.32B | -1.29B | -43.96B | 5.22B |
| Income Before Tax | 473.44B | 624.86B | 596.70B | 317.04B | 244.63B | 321.51B | 275.24B | 149.12B | 106.47B | 86.83B | -11.76B | 17.76B |
| Income Before Tax Ratio | 25.86% | 28.29% | 29.78% | 22.66% | 21.70% | 25.15% | 24.34% | 18.65% | 16.04% | 14.16% | -1.92% | 3.57% |
| Income Tax Expense | 109.48B | 153.27B | 159.62B | 74.10B | 59.42B | 73.28B | 70.84B | 33.87B | 28.53B | 14.90B | 7.46B | 11.41B |
| Net Income | 363.96B | 471.58B | 437.08B | 242.94B | 185.21B | 248.23B | 204.37B | 115.21B | 77.89B | 71.89B | -19.41B | 6.08B |
| Net Income Ratio | 19.88% | 21.35% | 21.81% | 17.36% | 16.43% | 19.42% | 18.07% | 14.41% | 11.73% | 11.72% | -3.17% | 1.22% |
| EPS | 781.20 | 1.01K | 935.95 | 520.74 | 390.19 | 504.53 | 415.16 | 234.09 | 153.70 | 133.38 | -36.07 | 11.30 |
| EPS Diluted | 781.20 | 1.00K | 931.30 | 517.77 | 388.01 | 502.41 | 413.74 | 233.45 | 153.33 | 133.38 | -36.07 | 11.30 |
| Weighted Avg Shares Out | 465.90M | 467.93M | 466.99M | 466.53M | 474.66M | 492.00M | 492.27M | 492.16M | 506.77M | 538.96M | 538.06M | 537.54M |
| Weighted Avg Shares Out (Dil) | 465.90M | 469.77M | 469.32M | 469.21M | 477.32M | 494.08M | 493.96M | 493.50M | 507.99M | 538.95M | 538.06M | 537.54M |

ASML, Tokyo Electron shares rally as US softens stance on China chip sanctions

Tokyo Electron Limited (TOELY) Q2 2025 Earnings Call Transcript

Tokyo Electron hikes FY profit forecast by 8.5%

Applied Materials, Lam Research, Or Tokyo Electron: Which Generalist Is The Most Likely To Outperform?

Tokyo Electron: Revenue Growth Recovery Underway

New Strong Buy Stocks for September 6th

Best Income Stocks to Buy for September 6th

ASML and Tokyo Electron shares surge on reported exemption from U.S. rules

Tokyo Electron: Q1 2024 Recovery After 2 Years Of Underperformance

Japan's Nikkei reclaims 39,000 level for first time since April
Source: https://incomestatements.info
Category: Stock Reports
