See more : mCloud Technologies Corp. (MCLD.V) Income Statement Analysis – Financial Results
Complete financial analysis of Trillion Energy International Inc. (TRLEF) income statement, including revenue, profit margins, EPS and key performance metrics. Get detailed insights into the financial performance of Trillion Energy International Inc., a leading company in the Oil & Gas Exploration & Production industry within the Energy sector.
- Vaudoise Assurances Holding SA (VAHN.SW) Income Statement Analysis – Financial Results
- Fill Up Media S.A. (ALFUM.PA) Income Statement Analysis – Financial Results
- Degama Software Solutions, Inc. (DGMA) Income Statement Analysis – Financial Results
- Ashley Gold Corp. (ASHL.CN) Income Statement Analysis – Financial Results
- PT Unilever Indonesia Tbk (UNVR.JK) Income Statement Analysis – Financial Results
Trillion Energy International Inc. (TRLEF)
About Trillion Energy International Inc.
Trillion Energy International Inc. operates as an oil and gas exploration and production company with assets in Turkey and Bulgaria. It owns 49% interests in the SASB natural gas field; 19.6% ownership interest in the Cendere oil field; 50% operating interest in the shut-in Bakuk gas field located near the Syrian border; and the Vranino 1-11 block, a 98,205 acres oil and gas exploration land located in Dobrudja Basin, Bulgaria. The company was formerly known as Park Place Energy Inc. and changed its name to Trillion Energy International Inc. in April 2019. Trillion Energy International Inc. was incorporated in 2015 and is headquartered in Vancouver, Canada.
| Metric | 2023 | 2022 | 2021 | 2020 | 2019 | 2018 | 2017 | 2016 | 2015 | 2014 | 2013 | 2012 | 2011 | 2010 | 2009 | 2008 | 2007 | 2006 | 2005 | 2004 |
|---|---|---|---|---|---|---|---|---|---|---|---|---|---|---|---|---|---|---|---|---|
| Revenue | 16.80M | 9.38M | 3.70M | 2.58M | 3.92M | 4.04M | 3.88M | 0.00 | 0.00 | 0.00 | 0.00 | 4.53K | 29.52K | 0.00 | 332.69K | 966.30K | 95.63K | 229.00 | 457.00 | 0.00 |
| Cost of Revenue | 5.07M | 5.16M | 2.88M | 2.66M | 2.97M | 3.70M | 3.61M | 0.00 | 0.00 | 0.00 | 0.00 | 3.48K | 43.12K | 0.00 | 645.99K | 1.37M | 32.70K | 0.00 | 0.00 | 0.00 |
| Gross Profit | 11.73M | 4.21M | 818.04K | -71.00K | 944.11K | 332.24K | 272.45K | 0.00 | 0.00 | 0.00 | 0.00 | 1.05K | -13.60K | 0.00 | -313.30K | -403.31K | 62.92K | 229.00 | 457.00 | 0.00 |
| Gross Profit Ratio | 69.80% | 44.92% | 22.10% | -2.75% | 24.11% | 8.23% | 7.02% | 0.00% | 0.00% | 0.00% | 0.00% | 23.15% | -46.09% | 0.00% | -94.17% | -41.74% | 65.80% | 100.00% | 100.00% | 0.00% |
| Research & Development | 0.00 | 0.00 | 0.00 | 0.00 | 0.00 | 0.00 | 0.00 | 0.00 | 0.00 | 0.00 | 0.00 | 0.00 | 0.00 | 0.00 | 0.00 | 0.00 | 0.00 | 0.00 | 279.00 | 703.30 |
| General & Administrative | 9.56M | 7.98M | 3.50M | 2.76M | 2.22M | 2.12M | 2.51M | 3.99M | 833.66K | 813.16K | 696.86K | 266.38K | 263.17K | 651.21K | 755.36K | 1.83M | 0.00 | 0.00 | 0.00 | 0.00 |
| Selling & Marketing | 123.29K | 519.32K | 28.86K | 0.00 | 0.00 | 212.01K | 0.00 | 0.00 | 0.00 | 0.00 | 0.00 | 2.08K | 24.10K | 0.00 | 0.00 | 0.00 | 0.00 | 0.00 | 0.00 | 0.00 |
| SG&A | 9.69M | 8.50M | 3.50M | 2.76M | 2.22M | 2.33M | 2.51M | 3.99M | 833.66K | 813.16K | 696.86K | 268.47K | 287.27K | 651.21K | 755.36K | 1.83M | 3.36M | 66.21K | 32.90K | 14.63K |
| Other Expenses | 0.00 | 1.83M | 2.60K | 2.51K | 60.64K | 0.00 | 63.02K | 0.00 | 0.00 | 0.00 | 0.00 | 0.00 | 0.00 | 0.00 | 0.00 | 0.00 | 0.00 | 0.00 | 0.00 | 0.00 |
| Operating Expenses | 9.69M | 9.40M | 3.92M | 3.19M | 2.64M | 2.33M | 2.75M | 3.99M | 833.66K | 813.16K | 697.87K | 264.87K | 289.42K | 657.71K | 770.91K | 2.10M | 3.36M | 67.17K | 34.63K | 15.34K |
| Cost & Expenses | 14.76M | 14.57M | 6.80M | 5.85M | 5.61M | 6.03M | 6.36M | 3.99M | 833.66K | 813.16K | 697.87K | 268.36K | 332.53K | 657.71K | 1.42M | 3.46M | 3.39M | 67.17K | 34.63K | 15.34K |
| Interest Income | 14.50K | 86.74K | 46.22K | 13.03K | 29.78K | 33.93K | 0.00 | 2.42K | 0.00 | 0.00 | 0.00 | 0.00 | -0.14 | 67.35K | 22.42K | 2.99K | 13.21K | 0.00 | 0.00 | 0.00 |
| Interest Expense | 2.25M | 79.69K | 126.03K | 119.69K | 50.73K | 0.00 | 76.03K | 12.40K | 0.00 | 0.00 | 0.00 | 0.00 | 7.70K | 0.00 | 0.00 | 0.00 | 0.00 | 0.00 | 0.00 | 0.00 |
| Depreciation & Amortization | 5.62M | 1.79M | 534.69K | 688.37K | 814.99K | 1.04M | 1.06M | 3.99M | -69.57K | 59.62K | 1.01K | 1.81K | 22.22K | 1.51K | 407.30K | 654.31K | 15.48K | 959.00 | 1.45K | 0.00 |
| EBITDA | 8.68M | -4.02M | -4.02M | -2.91M | -855.74K | -1.15M | -1.44M | 0.00 | -703.74K | -753.54K | -704.18K | -259.01K | -368.63K | -281.88K | -676.92K | -1.84M | -3.37M | -65.98K | -32.72K | -15.34K |
| EBITDA Ratio | 51.69% | -18.09% | -79.97% | -115.04% | -31.27% | -23.61% | -41.59% | 0.00% | 0.00% | 0.00% | 0.00% | -5,784.66% | -951.39% | 0.00% | -4.19% | -7.34% | -623.19% | -28,811.79% | -5,891.68% | 0.00% |
| Operating Income | 2.03M | -3.29M | -3.23M | -3.25M | -1.60M | -2.00M | -2.41M | -3.98M | -833.66K | -813.16K | -705.92K | -263.83K | -374.57K | -657.71K | -1.08M | -2.50M | -4.59M | -66.94K | -37.07K | -15.34K |
| Operating Income Ratio | 12.10% | -35.12% | -87.15% | -125.75% | -40.94% | -49.50% | -62.09% | 0.00% | 0.00% | 0.00% | 0.00% | -5,824.72% | -1,269.08% | 0.00% | -325.89% | -258.57% | -4,800.68% | -29,230.57% | -8,110.50% | 0.00% |
| Total Other Income/Expenses | -1.27M | -2.83M | -1.62M | -95.66K | 9.94K | -1.25M | -12.82K | -14.07K | 71.29K | -59.62K | 6.31K | 0.00 | -216.84K | 308.80K | -640.55K | -1.77M | -1.28M | 0.00 | -2.00K | 0.00 |
| Income Before Tax | 758.13K | -6.12M | -2.05M | -3.53M | -1.68M | -2.25M | -2.49M | -4.00M | -764.10K | -872.78K | -690.55K | -263.83K | -520.68K | -348.90K | -1.72M | -4.27M | -4.67M | 0.00 | -42.86K | 0.00 |
| Income Before Tax Ratio | 4.51% | -65.30% | -55.41% | -136.72% | -42.99% | -55.85% | -64.04% | 0.00% | 0.00% | 0.00% | 0.00% | -5,824.72% | -1,764.12% | 0.00% | -518.43% | -441.78% | -4,885.31% | 0.00% | -9,377.90% | 0.00% |
| Income Tax Expense | 1.86M | 1.91M | 128.63K | 122.20K | 111.37K | 3.00 | 139.05K | -3.97M | 0.00 | 0.00 | -7.32K | 5.41K | 7.70K | -376.15K | 640.55K | 1.77M | -293.91K | 0.00 | 2.90K | 15.34K |
| Net Income | -1.10M | -6.12M | -2.05M | -3.53M | -1.68M | -2.25M | -2.49M | -4.00M | -764.10K | -872.78K | -690.55K | -263.83K | -520.68K | -281.56K | -1.72M | -4.27M | -4.38M | -66.94K | -37.07K | -15.34K |
| Net Income Ratio | -6.56% | -65.30% | -55.41% | -136.72% | -42.99% | -55.85% | -64.04% | 0.00% | 0.00% | 0.00% | 0.00% | -5,824.72% | -1,764.12% | 0.00% | -518.43% | -441.78% | -4,577.96% | -29,230.57% | -8,110.50% | 0.00% |
| EPS | -0.01 | -0.10 | -0.06 | -0.18 | -0.10 | -0.16 | -0.22 | -0.40 | -0.08 | -0.11 | -0.14 | -0.06 | -0.13 | -0.07 | -0.78 | -2.29 | -1.20 | -0.01 | 0.00 | 0.00 |
| EPS Diluted | -0.01 | -0.10 | -0.06 | -0.18 | -0.10 | -0.16 | -0.22 | -0.40 | -0.08 | -0.11 | -0.14 | -0.06 | -0.13 | -0.07 | -0.78 | -2.29 | -1.20 | -0.01 | 0.00 | 0.00 |
| Weighted Avg Shares Out | 81.09M | 62.49M | 31.63M | 19.35M | 16.77M | 14.12M | 11.20M | 10.09M | 9.15M | 7.95M | 4.92M | 4.13M | 4.16M | 4.19M | 2.21M | 1.86M | 3.66M | 6.59M | 10.87M | 9.60M |
| Weighted Avg Shares Out (Dil) | 81.08M | 62.49M | 31.63M | 19.35M | 16.77M | 14.12M | 11.20M | 10.09M | 9.15M | 7.95M | 4.92M | 4.13M | 4.16M | 4.19M | 2.21M | 1.86M | 3.66M | 6.59M | 9.60M | 9.60M |
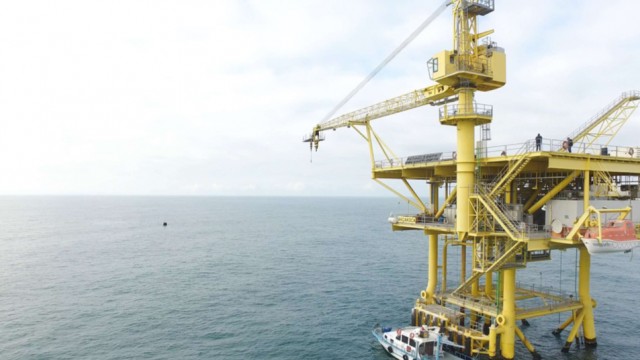
Trillion Energy International shares rise on strategic partnership with natural gas company

TRILLION ENERGY TO EXPLORE STRATEGIC ENERGY OPPORTUNITIES WITH MAJOR NATURAL GAS COMPANY

TRILLION ENERGY ANNOUNCES 40+ METRES GAS PAY IN ALAPLI 2 GAS WELL
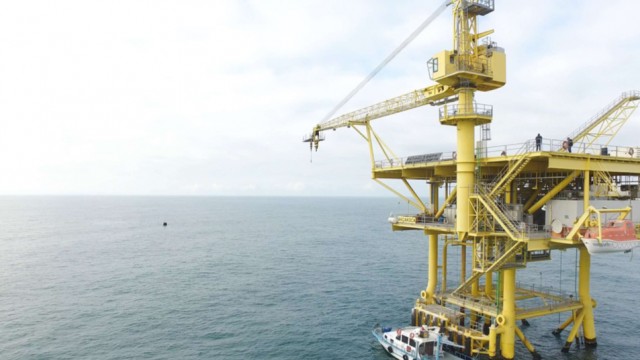
Trillion Energy International says Bayhanli-2 gas well now in production
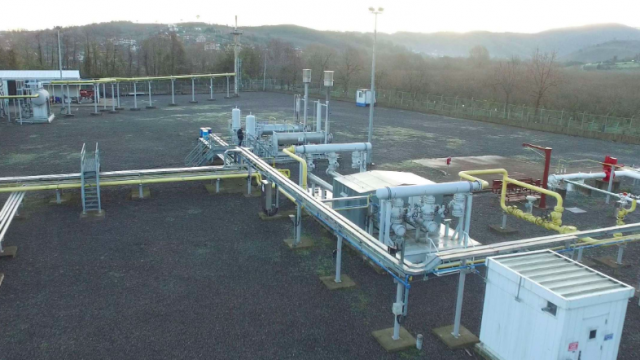
Trillion Energy International reports record 1Q sales as it progresses SASB gas field
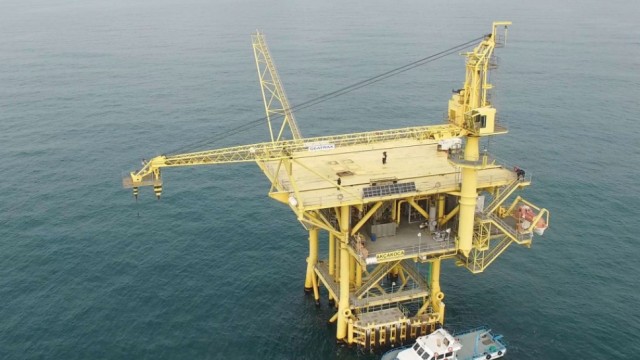
Trillion Energy International drills 43m of gas pay at Bayhanli 2 well in Turkiye
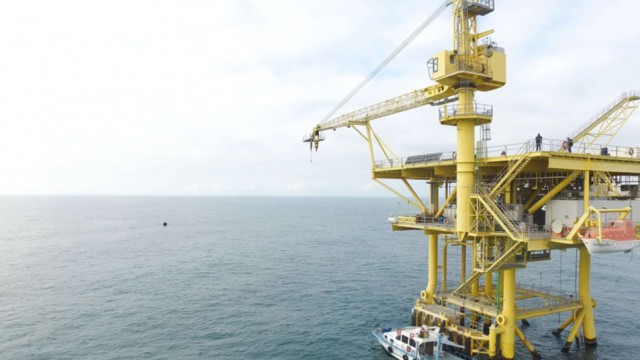
Trillion Energy closes $15M offering to fund asset development in Turkey

Trillion Energy International confirms spud of Bayhanli-2 well
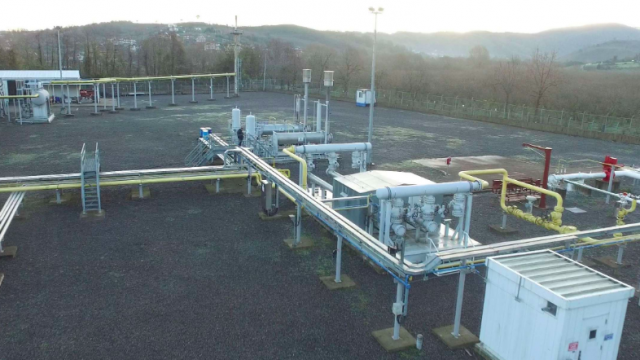
Trillion Energy says January report revealed additional natural gas discoveries at project in Turkey
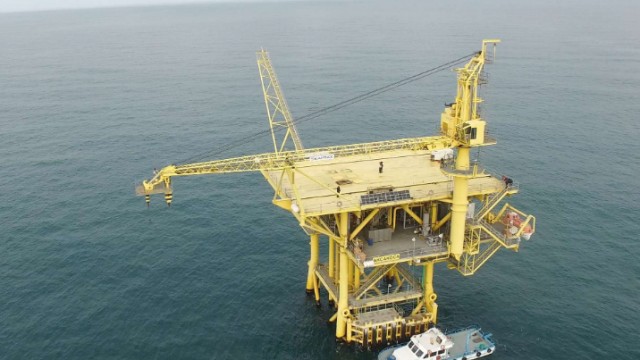
Trillion Energy International says Guluc-2 well tests 16.35 MMcf per day
Source: https://incomestatements.info
Category: Stock Reports
