See more : Nickel Creek Platinum Corp. (NCP.TO) Income Statement Analysis – Financial Results
Complete financial analysis of TUI AG (TUIFF) income statement, including revenue, profit margins, EPS and key performance metrics. Get detailed insights into the financial performance of TUI AG, a leading company in the Travel Services industry within the Consumer Cyclical sector.
- PROG Holdings, Inc. (PRG) Income Statement Analysis – Financial Results
- Rego Payment Architectures, Inc. (RPMT) Income Statement Analysis – Financial Results
- Ontex Group NV (ONXXF) Income Statement Analysis – Financial Results
- Waste Connections, Inc. (WCN) Income Statement Analysis – Financial Results
- Chengdu Spaceon Electronics Co., Ltd. (002935.SZ) Income Statement Analysis – Financial Results
TUI AG (TUIFF)
About TUI AG
TUI AG, together with its subsidiaries, provides tourism services worldwide. It operates hotels and resorts under the Robinson, Riu, TUI Blue, Blue Diamond, TUI Suneo, and TUI Magic Life brands. The company is also involved in the tour operation and airlines businesses. In addition, it operates cruise liners. The company operates a fleet of 1,600 travel agencies and online portals; 5 airlines with approximately 150 aircraft; and 15 cruise liners, as well as approximately 400 hotels. The company was formerly known as Preussag AG and changed its name to TUI AG in June 2002. TUI AG is headquartered in Hanover, Germany.
| Metric | 2024 | 2023 | 2022 | 2021 | 2020 | 2019 | 2018 | 2017 | 2016 | 2015 | 2014 | 2013 | 2012 | 2011 | 2010 | 2009 | 2008 | 2007 | 2006 | 2005 | 2004 |
|---|---|---|---|---|---|---|---|---|---|---|---|---|---|---|---|---|---|---|---|---|---|
| Revenue | 23.17B | 20.67B | 16.54B | 4.73B | 7.94B | 18.93B | 19.52B | 18.54B | 17.18B | 20.01B | 18.71B | 18.48B | 18.33B | 17.48B | 16.35B | 18.71B | 21.87B | 20.51B | 18.20B | 18.05B | 19.22B |
| Cost of Revenue | 21.22B | 19.05B | 15.61B | 5.96B | 9.93B | 17.26B | 17.54B | 16.54B | 15.28B | 17.62B | 16.44B | 16.44B | 16.29B | 15.66B | 14.68B | 17.23B | 20.33B | 15.48B | 12.90B | 12.36B | 13.41B |
| Gross Profit | 1.95B | 1.61B | 931.60M | -1.22B | -1.98B | 1.67B | 1.98B | 2.00B | 1.91B | 2.40B | 2.28B | 2.04B | 2.04B | 1.83B | 1.67B | 1.49B | 1.53B | 5.03B | 5.30B | 5.69B | 5.80B |
| Gross Profit Ratio | 8.40% | 7.81% | 5.63% | -25.86% | -24.96% | 8.83% | 10.15% | 10.79% | 11.09% | 11.97% | 12.17% | 11.05% | 11.15% | 10.44% | 10.21% | 7.94% | 7.02% | 24.52% | 29.11% | 31.51% | 30.21% |
| Research & Development | 0.00 | 0.00 | 64.50M | 91.30M | 103.70M | 66.00M | 47.80M | 0.00 | 0.00 | 0.00 | 0.00 | 0.00 | 0.00 | 0.00 | 0.00 | 0.00 | 0.00 | 0.00 | 0.00 | 0.00 | 0.00 |
| General & Administrative | 275.70M | 299.90M | 116.90M | 152.20M | 218.10M | 334.10M | 416.60M | 389.80M | 394.50M | 559.40M | 504.00M | 519.00M | 1.56B | 1.51B | 1.54B | 1.38B | 1.39B | 969.40M | 742.50M | 765.30M | 807.80M |
| Selling & Marketing | 0.00 | 0.00 | 0.00 | 0.00 | 0.00 | 0.00 | 0.00 | 0.00 | 0.00 | 0.00 | 0.00 | 0.00 | 0.00 | 0.00 | 0.00 | 0.00 | 0.00 | 811.30M | 1.06B | 1.10B | 1.04B |
| SG&A | 275.70M | 299.90M | 116.90M | 152.20M | 218.10M | 334.10M | 416.60M | 389.80M | 394.50M | 559.40M | 504.00M | 519.00M | 1.56B | 1.51B | 1.54B | 1.38B | 1.39B | 1.78B | 1.80B | 1.87B | 1.85B |
| Other Expenses | 1.67B | 1.31B | 629.30M | 688.30M | 799.30M | 885.30M | 0.00 | 10.60M | 28.90M | 43.20M | 33.80M | 0.00 | 0.00 | 0.00 | 0.00 | 0.00 | 0.00 | -25.20M | -113.90M | -176.80M | -255.70M |
| Operating Expenses | 1.95B | 1.61B | 746.20M | 840.50M | 1.02B | 1.22B | 1.29B | 1.26B | 1.22B | 1.71B | 1.58B | 1.54B | 1.56B | 1.51B | 1.54B | 3.70B | 1.39B | 5.07B | 4.82B | 4.37B | 4.80B |
| Cost & Expenses | 23.17B | 20.04B | 16.36B | 6.80B | 10.94B | 18.48B | 18.84B | 17.79B | 16.49B | 19.33B | 18.01B | 17.98B | 17.84B | 17.16B | 16.22B | 20.93B | 21.72B | 20.55B | 17.73B | 16.73B | 18.21B |
| Interest Income | 95.00M | 76.40M | 24.90M | 11.60M | 19.80M | 80.60M | 67.50M | 19.50M | 19.50M | 20.30M | 24.70M | 115.80M | 150.20M | 243.60M | 300.90M | 201.90M | 186.10M | 163.90M | 160.80M | 160.80M | 150.60M |
| Interest Expense | 509.90M | 509.00M | 484.30M | 450.80M | 301.60M | 154.70M | 149.80M | 133.00M | 187.50M | 187.80M | 250.10M | 353.20M | 426.10M | 483.20M | 470.30M | 500.50M | 442.70M | 390.40M | 377.10M | 377.10M | 342.50M |
| Depreciation & Amortization | 846.60M | 859.10M | 859.80M | 894.10M | 1.05B | 496.40M | 430.80M | 403.00M | 390.70M | 700.50M | 398.60M | 429.40M | 398.70M | 412.20M | 456.50M | 865.10M | 827.40M | 1.45B | 529.80M | 565.30M | 1.33B |
| EBITDA | 2.22B | 1.92B | 1.22B | -1.27B | -1.33B | 1.36B | 1.56B | 1.73B | 1.38B | 1.35B | 1.14B | 856.20M | 1.08B | 1.10B | 1.10B | 1.11B | 998.00M | 1.36B | 1.10B | 1.29B | 1.33B |
| EBITDA Ratio | 9.57% | 9.29% | 7.17% | -26.89% | -15.22% | 7.27% | 7.68% | 9.23% | 8.13% | 7.22% | 6.37% | 5.95% | 5.56% | 5.90% | 6.46% | 5.91% | 5.40% | 4.15% | 6.62% | 9.27% | 7.68% |
| Operating Income | 0.00 | 597.40M | 303.30M | -2.28B | -2.78B | 866.30M | 1.06B | 1.19B | 818.30M | 743.80M | 794.10M | 670.70M | 620.00M | 619.40M | 599.70M | 241.10M | 353.80M | -598.00M | 675.10M | 1.11B | 149.20M |
| Operating Income Ratio | 0.00% | 2.89% | 1.83% | -48.29% | -35.03% | 4.58% | 5.43% | 6.44% | 4.76% | 3.72% | 4.24% | 3.63% | 3.38% | 3.54% | 3.67% | 1.29% | 1.62% | -2.91% | 3.71% | 6.14% | 0.78% |
| Total Other Income/Expenses | 861.40M | -46.20M | -363.80M | -512.30M | -646.50M | -174.60M | -89.10M | -113.10M | -200.00M | -249.70M | -295.40M | -359.30M | -367.30M | -109.50M | 43.80M | -601.90M | -452.40M | 703.30M | -657.70M | -164.90M | -237.30M |
| Income Before Tax | 861.40M | 551.20M | -145.90M | -2.46B | -3.20B | 691.40M | 971.50M | 1.08B | 618.30M | 535.40M | 505.60M | 325.50M | 252.70M | 206.80M | 177.80M | -360.80M | 237.10M | -736.10M | 385.50M | 621.80M | 246.00M |
| Income Before Tax Ratio | 3.72% | 2.67% | -0.88% | -52.03% | -40.33% | 3.65% | 4.98% | 5.83% | 3.60% | 2.68% | 2.70% | 1.76% | 1.38% | 1.18% | 1.09% | -1.93% | 1.08% | -3.59% | 2.12% | 3.45% | 1.28% |
| Income Tax Expense | 154.00M | 95.50M | 66.70M | 19.20M | -64.20M | 159.50M | 191.30M | 168.80M | 153.40M | 87.00M | 221.70M | 139.00M | 110.80M | 88.60M | 64.20M | 39.80M | 800.00K | 127.60M | 86.90M | 89.70M | -68.90M |
| Net Income | 507.10M | 305.80M | -212.60M | -2.48B | -3.14B | 416.20M | 732.50M | 644.80M | 1.04B | 340.40M | 104.70M | 4.30M | -15.10M | 23.90M | 101.80M | -121.30M | 175.10M | -893.30M | 456.70M | 488.30M | 275.00M |
| Net Income Ratio | 2.19% | 1.48% | -1.28% | -52.43% | -39.52% | 2.20% | 3.75% | 3.48% | 6.04% | 1.70% | 0.56% | 0.02% | -0.08% | 0.14% | 0.62% | -0.65% | 0.80% | -4.35% | 2.51% | 2.71% | 1.43% |
| EPS | 1.00 | 0.75 | -0.69 | -11.65 | -15.02 | 2.00 | 3.52 | 3.11 | 5.00 | 1.87 | 1.03 | 0.05 | -0.17 | 0.27 | 1.14 | -1.36 | 1.96 | -10.03 | 6.42 | 7.71 | 4.35 |
| EPS Diluted | 1.00 | 0.75 | -0.69 | -11.65 | -15.02 | 2.00 | 3.51 | 3.11 | 4.99 | 1.85 | 1.03 | 0.05 | -0.17 | 0.27 | 0.92 | -1.17 | 1.73 | -9.31 | 5.89 | 7.71 | 4.35 |
| Weighted Avg Shares Out | 505.98M | 407.73M | 308.97M | 212.94M | 208.93M | 208.52M | 208.33M | 207.54M | 207.43M | 182.22M | 101.76M | 89.66M | 89.59M | 89.38M | 89.32M | 89.23M | 89.15M | 89.04M | 71.09M | 63.37M | 63.24M |
| Weighted Avg Shares Out (Dil) | 505.97M | 406.36M | 308.97M | 212.94M | 208.93M | 208.55M | 208.63M | 207.56M | 207.98M | 184.49M | 101.76M | 89.66M | 89.59M | 89.38M | 110.31M | 103.91M | 101.23M | 95.93M | 77.58M | 63.37M | 63.24M |

TUI's revenue lifted by jump in customers and rising prices
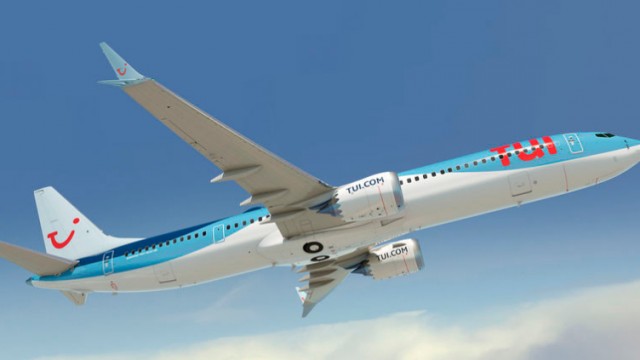
TUI, house prices and meme stock fun with GameStop: Wednesday's preview:

TUI results could provide boost

TUI AG: Return To Profitability Seems Imminent But Is It A Good Investment?

TUI expects late holiday rush as people seek cooler destinations

TUI's backs guidance as bookings near pre-Covid levels
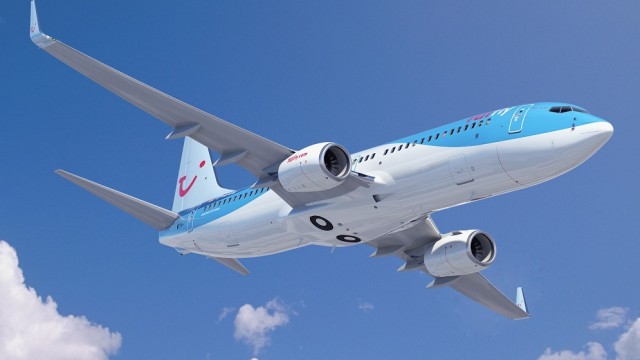
TUI needs to show consistent forward bookings to keep investors on board

Tui Group share price forms 2 bearish patterns as headwinds rise

TUI: Q3 2023 Clarifies The Forward Positive Thesis

‘I apologise for the confusion': travel firm Tui launches AI tour guide
Source: https://incomestatements.info
Category: Stock Reports
